. 2017 Oct 2;8(12):8150–8163. doi: 10.1039/c7sc02199b

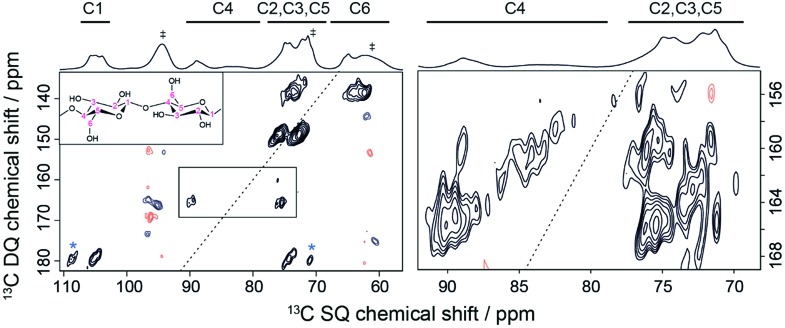
Fig. 7. DNP-enhanced 2D DQ-SQ 13C–13C SPC5 (ref. 76) dipolar correlation spectrum recorded on microcrystalline cellulose at natural isotopic abundance at 18.8 T and ∼125 K. The MAS frequency was 6.9 kHz and the number of scans was 32. The spectrum was obtained in 16 hours with a recycling delay of 24 s, and 1.16 ms of SPC5 total mixing time. A corresponding DNP-enhanced {1H}–13C CPMAS spectrum is shown on the top. Solvent peaks, as well as spinning sideband contributions from 13C-urea present in the DNP matrix are indicated by a dagger symbol. (Left) Full DQ-SQ cellulose spectrum. Cross-peaks marked with a star represent spinning sideband contributions. (Right) Zoom on the C4 to C3/C5 cross-peaks. Note that the contour levels on the right-hand side were chosen just above the noise level in order to see the correlations from the amorphous C4 peaks.

Fig. 7