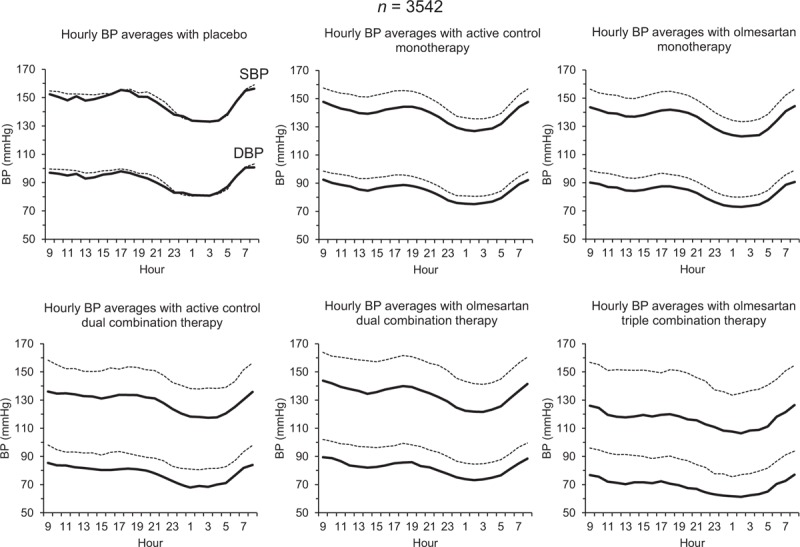
FIGURE 2.

Average hourly SBP and DBP values at baseline (dashed lines) and at the end of the double-blind treatment (continuous lines) in patients treated with placebo (n = 119), active control monotherapy (n = 1195), olmesartan monotherapy (n = 1410), active control dual combination therapy (n = 79), olmesartan dual combination therapy (n = 637), and olmesartan triple combination therapy (n = 102). BP, blood pressure.
