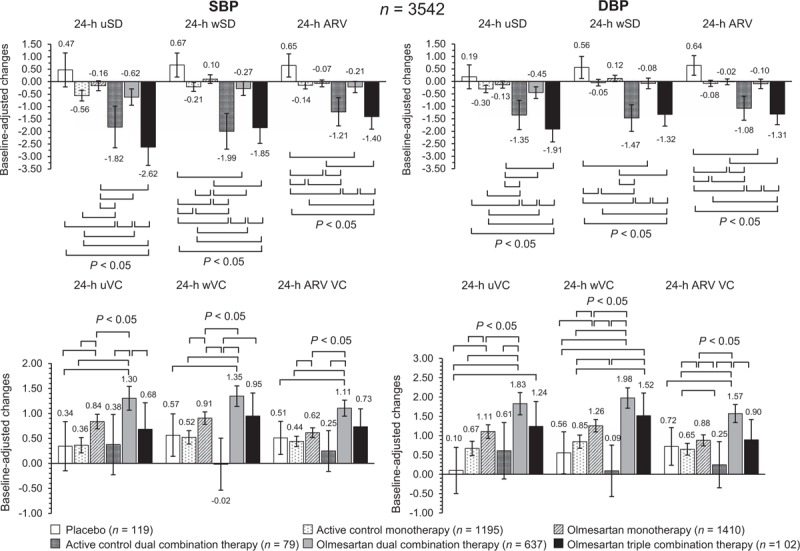
FIGURE 3.

Adjusted average changes (95% confidence interval) in 24-h SBP and DBP variability from baseline after double blind treatment with placebo (n = 119), active control monotherapy (n = 1195), olmesartan monotherapy (n = 1410), active control dual combination therapy (n = 79), olmesartan dual combination therapy (n = 637), and olmesartan triple combination therapy (n = 102). BPV is shown as uSD, wSD, or ARV, and as uVC, wVC, or variation coefficient of average real variability. The statistical significance of differences between individual pairs of treatments is indicated by the P value. Changes are adjusted for baseline value, age, sex, BMI, and region. ARV VC, variation coefficient of average real variability; uVC, unweighted variation coefficient; uSD, unweighted SD; wVC, weighted variation coefficient; wSD, weighted SD.
