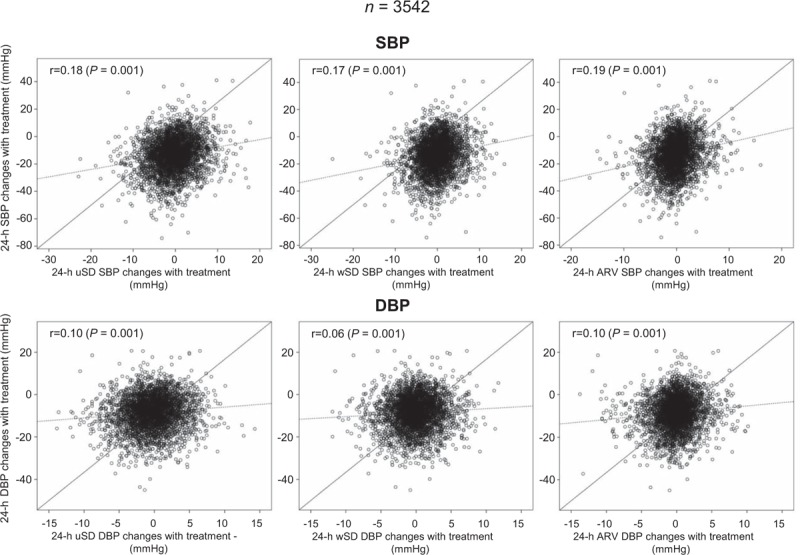
FIGURE 4.

Correlation between 24-h average SBP or DBP changes with treatment and changes in 24-h SBP or DBP variability with treatment. BP variability is shown as uSD, wSD, or ARV. The correlation coefficient (r) and its statistical significance (P) are shown inside each panel. The continuous line refers to the identity line, the dashed line to the line of best fit (or trend line). ARV, average real variability; uSD, unweighted SD; wSD, weighted SD.
