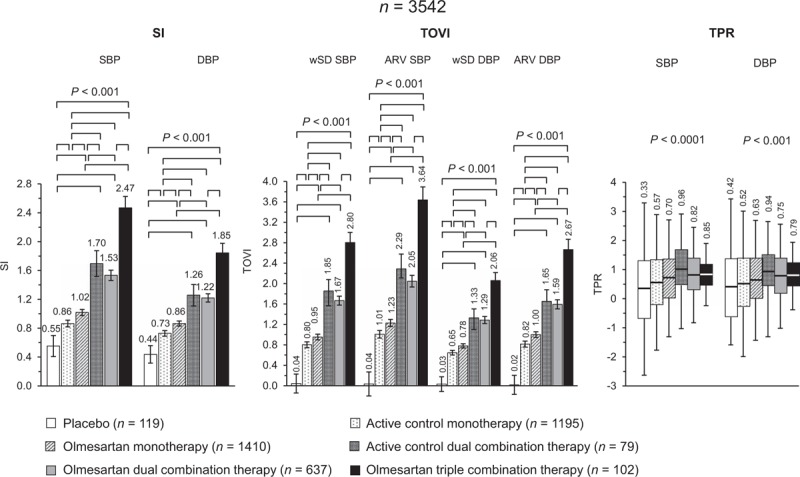
FIGURE 5.

Adjusted average (95% confidence interval) SI and TOVI, and boxplots of TPR after double blind treatment with placebo (n = 119), active control monotherapy (n = 1195), olmesartan monotherapy (n = 1410), active control dual combination therapy (n = 79), olmesartan dual combination therapy (n = 637), and olmesartan triple combination therapy (n = 102). Data are shown for SBP and DBP. The statistical significance of differences between individual pairs of treatments is indicated by the P value. SI and TOVI data are adjusted for age, sex, BMI and region. ARV, average real variability; SI, smoothness index; TOVI, treatment on variability index; TPR, trough-to-peak ratio; wSD, weighted SD.
