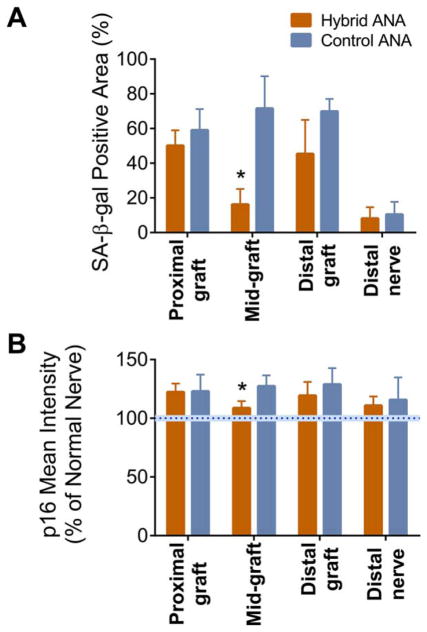
FIGURE 3.
Evaluation of markers of cellular senescence within ANAs 4 weeks after defect reconstruction. Hybrid and control ANAs were divided into regions to evaluate staining for SA-β-gal activity (A) and p16 expression (B) (intensity normalized to uninjured nerve indicated by blue dotted bar). The hybrid ANAs’ midgraft region had decreased senescence markers. Data represent mean ± standard deviation (n = 4 per group). *P < 0.05 vs. control ANA. [Color figure can be viewed at wileyonlinelibrary.com]

