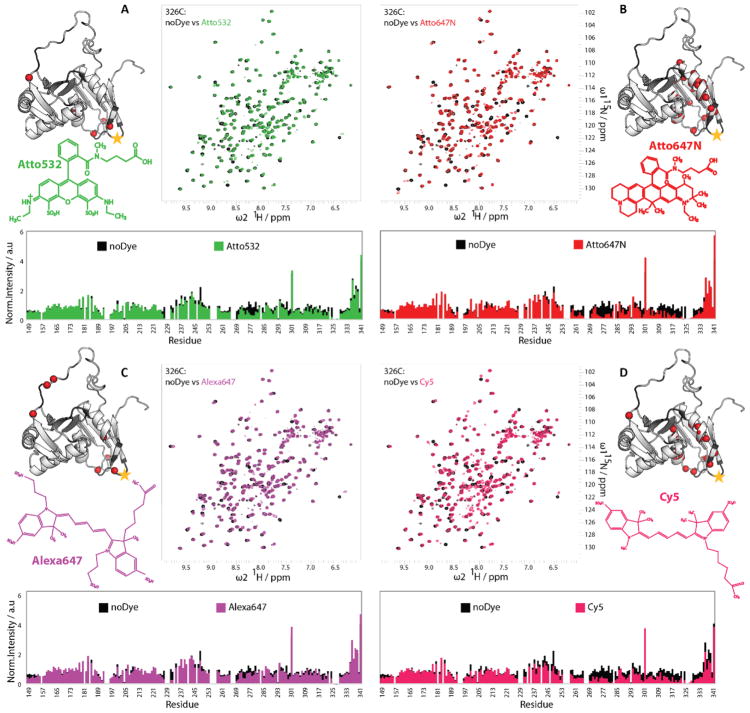
Figure 3. Effect of different fluorophores at position C326 on the conformation of U2AF65 RRM1,2.
1 H,15N-HSQC spectra and intensity versus residue plots of unlabeled RRM1,2 (black) compared to (A) RRM1,2-C326 fluorescently labeled with Atto532 (green), (B) Atto647N (red), (C) Alexa647 (magenta), or (D) Cy5 (pink). Next to each spectrum are the structural formulas of the respective dyes and the structural representations of RRM1,2, where the red spheres indicate the residues with loss of more than 60% of peak height upon fluorophore labeling.

