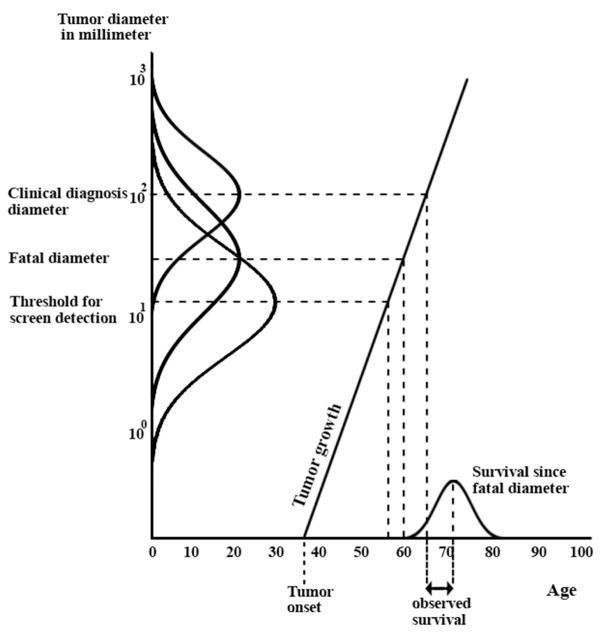
Figure 2.
The MISCAN-Fadia breast cancer natural history model. After tumor onset, the values of six tumor characteristics are generated: growth rate of the tumor, the tumor’s fatal diameter that represents distant metastasis, survival time after reaching the fatal diameter, screen detectability diameter (threshold), and the clinical diagnosis diameter. The distribution curves on the y-axis demonstrate the probabilistic nature of the simulations and the variation between the screen-detection, fatal and clinical diagnosis diameter of tumors. The growth rate of the tumor determines the times since its initiation at which the tumor reaches the screen detectability diameter, the clinical diagnosis diameter, and the fatal diameter. If in the absence of screening the clinical diagnosis diameter is larger than the fatal diameter, the woman will die of breast cancer and the observed survival time is given as depicted in Figure 2. A woman will be cured if the breast cancer is detected, either clinically or through screening, before the fatal diameter is reached. Treatment (not shown in Figure 2) is modeled as a shift in fatal diameter and may affect survival and in the best scenario cause of death.

