Figure 3. Incidence and Mortality over time compared to SEER.
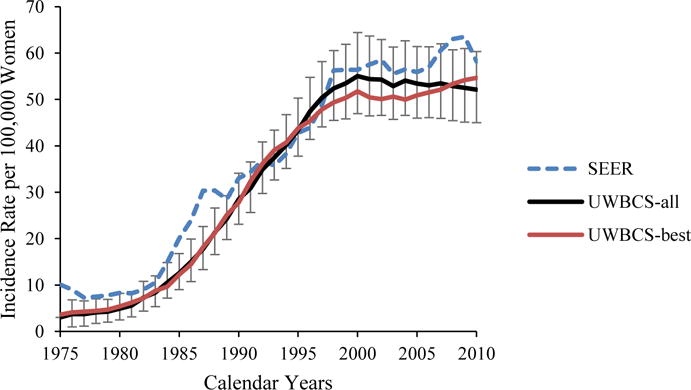
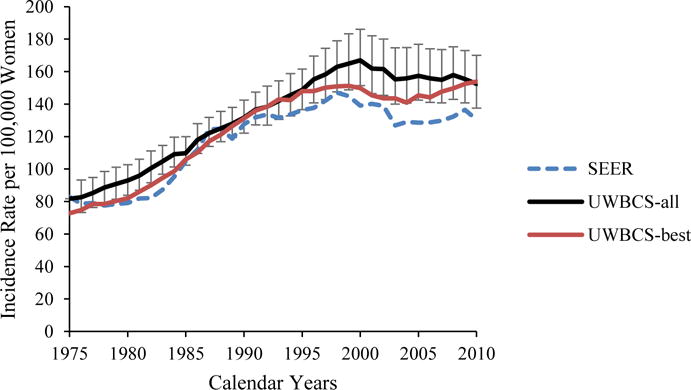
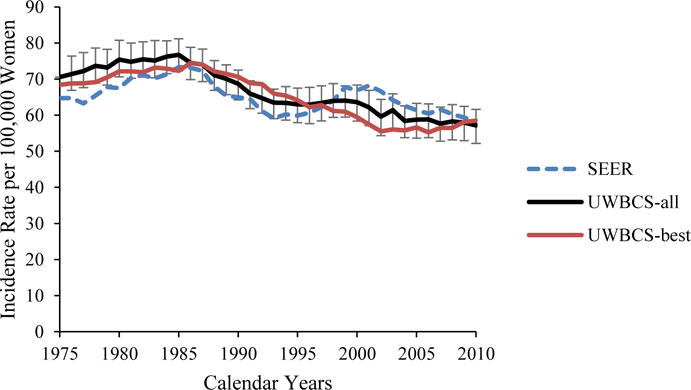
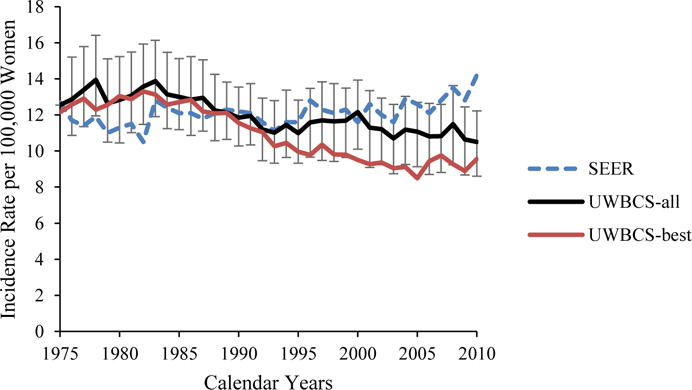
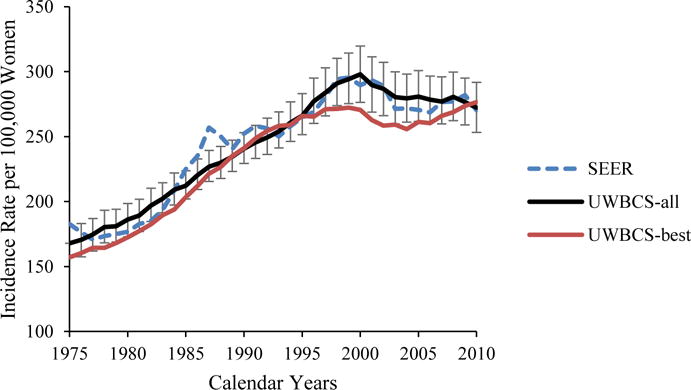
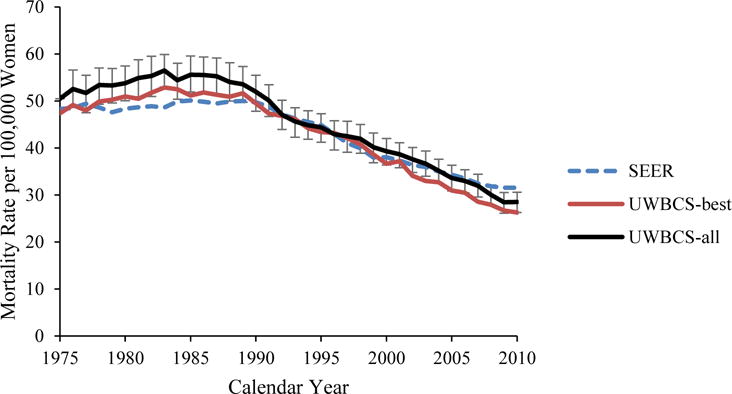
UWBCS-best represents the outcomes obtained when the best input vector is used and UWBCS-all represents the outcomes obtained when 310 input vectors that have a score of 9 or less are used. The errors bars around UWBCS-all represent 95% “uncertainty intervals,” which are generated using the 2.5th and 97.5th percentiles’ values among 310 vectors at each annual time point for each model output.
(a) Age-Adjusted (30–79 years) Insitu Breast Cancer Incidence
(b) Age-Adjusted (30–79 years) Localized Breast Cancer Incidence
(c) Age-Adjusted (30–79 years) Regional Breast Cancer Incidence
(d) Age-Adjusted (30–79 years) Distant Breast Cancer Incidence
(e) Overall Age-Adjusted (30–79 years) Breast Cancer Incidence
(f) Age-Adjusted (30–79 years) Breast Cancer Mortality
