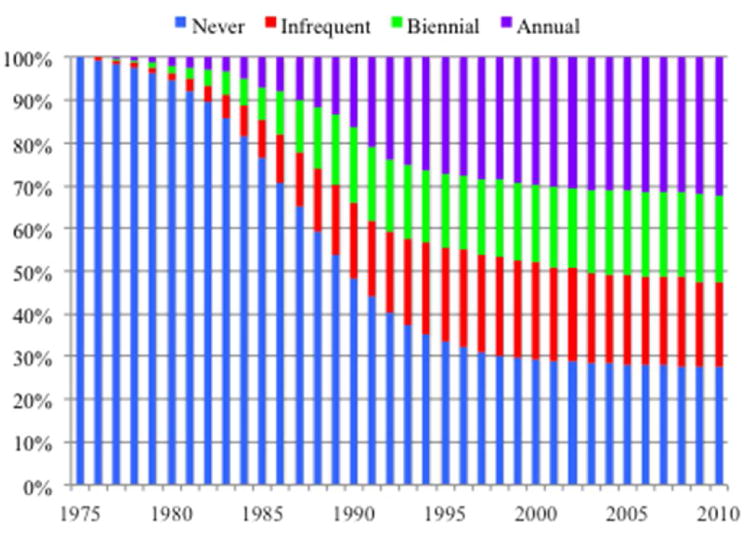
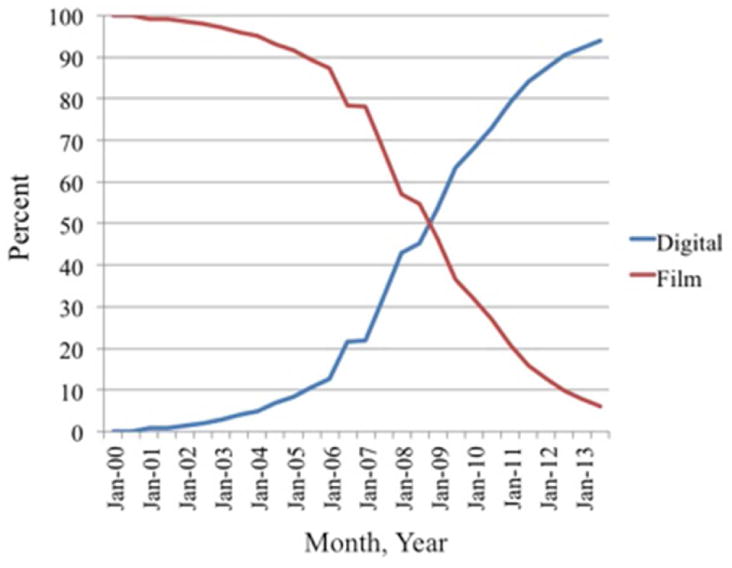
Figure 2. Mammography Use of Time.


Panel A. The use of screening (annual, every two years, irregular, and never) among women ages 30–79 by calendar year. These observed data were used a targets in modeling dissemination of screening and intervals between screens. Note that the rate of never screened includes women ages 30–39.
Panel B. The percent of total mammograms performed in the US that were digital vs. plain film by calendar year. Source: Breast Cancer Surveillance Consortium (BCSC, unpublished data) and the FDA’s Mammography Quality Standards Act and Program. (43)
