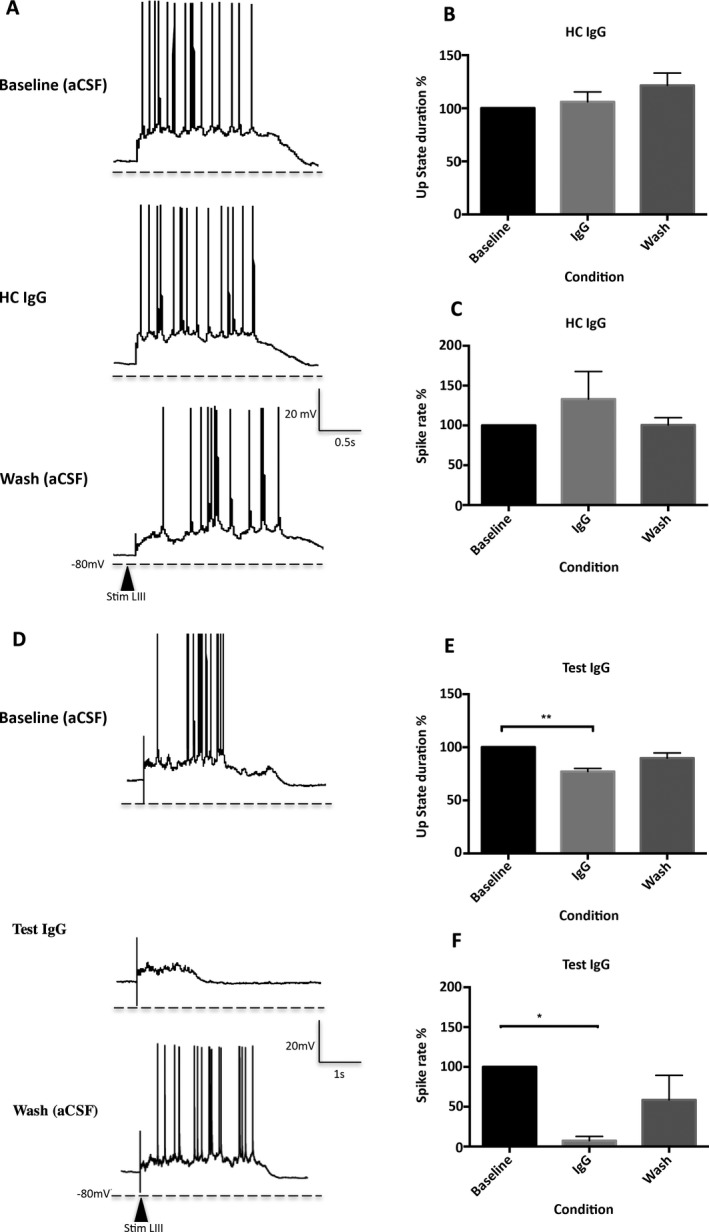
Figure 2.

The effect of IgG on UP state duration and spike rate. (A–C) Effect of HC IgG (100 μg/mL) on UP states. Representative image showing UP state duration and spike rate are unaffected following the application of HC IgG. Top panel: UP state recordings taken during baseline recordings in aCSF. Middle panel: HC IgG (100 μg/mL). Bottom panel: following aCSF wash. LIII; Layer III, Stim; Stimulation (A). Following application of HC IgG, UP state duration and spike rate were unaffected (pooled data from 4 slices) (B and C). (D–F) Effect of test IgG (GABABR patient IgG) on UP states. Representative image showing both UP state duration and the spike rate were significantly reduced following the application of patient IgG. Top panel: UP state recordings taken during baseline recordings in aCSF. Middle panel: test IgG (100 μg/mL). Bottom panel: following aCSF wash. LIII; Layer III, Stim; Stimulation (D). UP state duration was significantly reduced following the application of test IgG (**p = 0.0028, pooled data n = 6) (E). Similarly, a significant reduction was noted in spikes present during UP state events following application of test IgG (*p = 0.0185, pooled data n = 5) (F).
