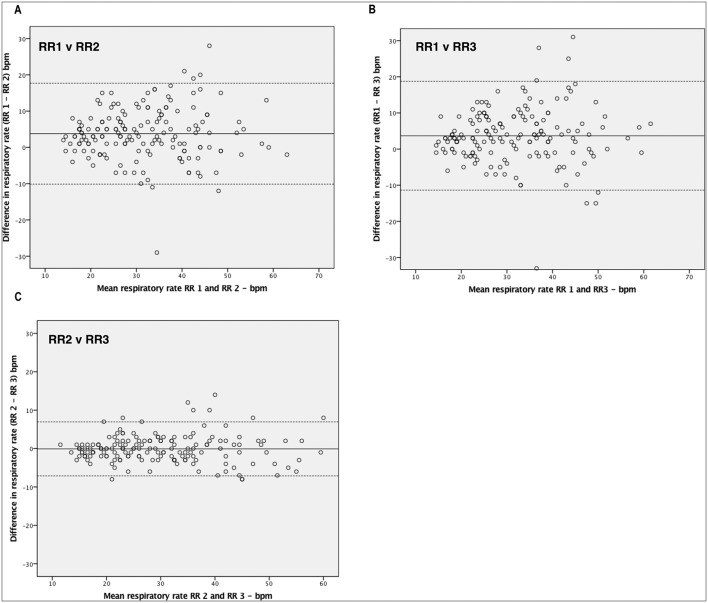
Figure 2.
Bland-Altman plots assessing pairwise agreement for respiratory measurements by A. RR 1 and RR 2 B. RR 1 and RR 3 C. RR 2 and RR 3. The x-axis represents the mean values of the two measurements and the y-axis the difference between the two. The solid line shows the mean bias and the dashed lines the 95% CI based on the standard deviation of the distribution.

