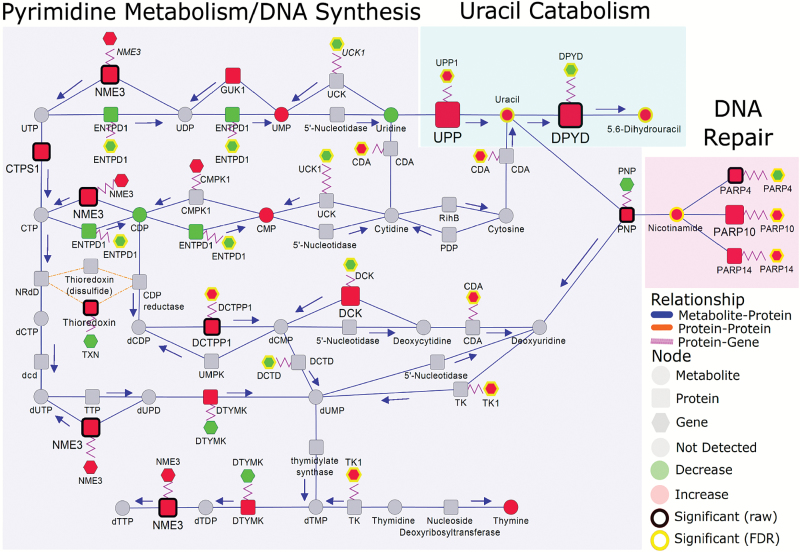
Figure 4.
Integrated networks illustrating relationship between metabolites, proteins and genes related to pyrimidine metabolism, uracil catabolism and DNA repair. Metabolites, proteins and genes are represented by circle, square and hexagonal respectively. Node size indicates absolute magnitude of change. Node color shows the direction of changes comparing lung tumor and control tissues (red: increased in adenocarcinoma; green: decreased). Gray nodes represent features that were not detected. Significance is determined by yellow borders (pFDR < 0.05) or black borders (raw P < 0.05). Blue edges connect metabolites and proteins based on their enzymatic association. Purple edges link a protein and its encoding gene. Shaded areas represent the different biosynthetic pathways. Arrows indicate the direction of the respective enzymatic reaction.

