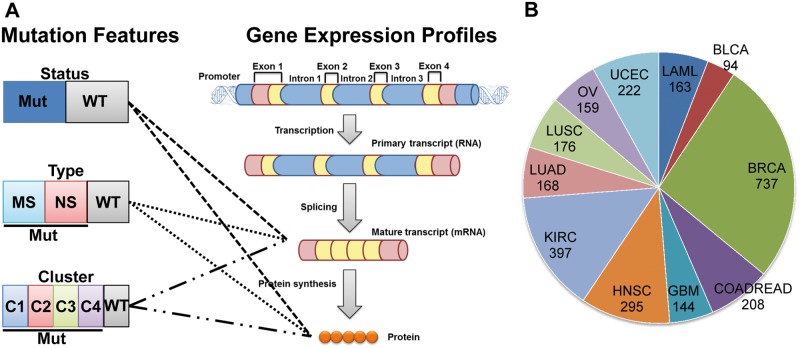
Figure 1.
Illustration of association studies of mutation features with expression in human cancer. (A) Schematic description of the three mutation features and analysis steps. We defined mutation types, mutation clusters and mutation statuses as three independent mutation features. For each gene, its WT samples remained the same in all three features, whereas its mutated samples (Mut status) were further separated as NS or MS in the feature of mutation type, or categorized into multiple cluster groups (C1, C2, C3 and C4 in the feature of mutation cluster). For gene expression, we considered mRNA expression measured by RNA sequencing data and protein expression measured by the RPPA platform. (B) Pie chart shows the number of samples used in each cancer that had somatic mutation, RNA sequencing and copy number variation data in each sample. A colour version of this figure is available at BIB online: https://academic.oup.com/bib.

