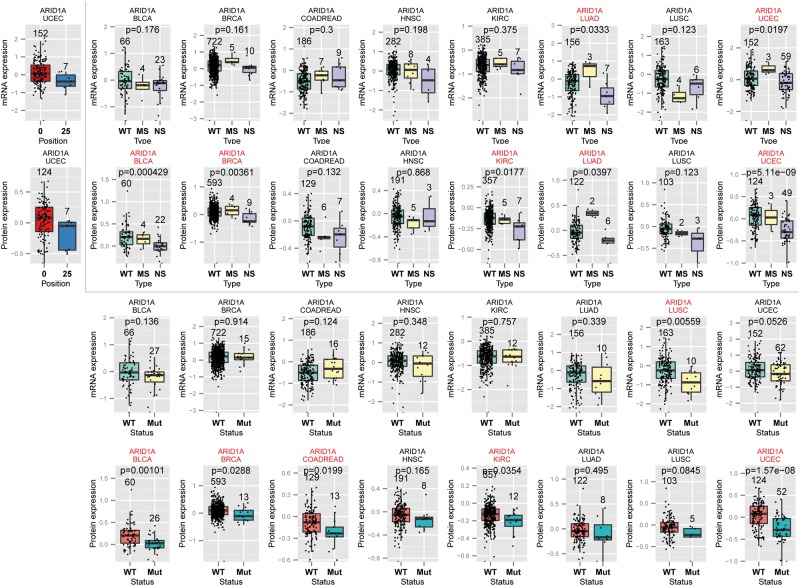
Figure 3.
Comparison of ARID1A expression level in each mutation feature group. (A) Mutation cluster plots on mRNA and protein expression. The x-axis shows the cluster index, where x = 0 indicates the wild type (WT) group and x = 27 indicates the 27th mutation cluster around 1324th–1335th amino acids. (B) Mutation type plots in eight cancers. The top panel showed ARID1A mRNA expression versus its three mutation types: NS, MS and WT. The bottom panel showed its protein expression versus the three mutation types. The P-values were calculated by Wilcoxon rank sum test between the NS group and the WT group. (C) Mutation status plots. Similarly to (B), the top and bottom panel showed ARID1A mRNA and protein expression, respectively, versus its mutation status. The P-values shown were obtained based on Wilcoxon rank sum test comparing the mutated group (Mut) and the WT group. In (B) and (C), we showed all eight cancer types in which ARID1A was eligible for the corresponding feature association test and highlighted those that were nominally significant (nominal P < 0.05). Sample size was labeled for each feature group. A colour version of this figure is available at BIB online: https://academic.oup.com/bib.

