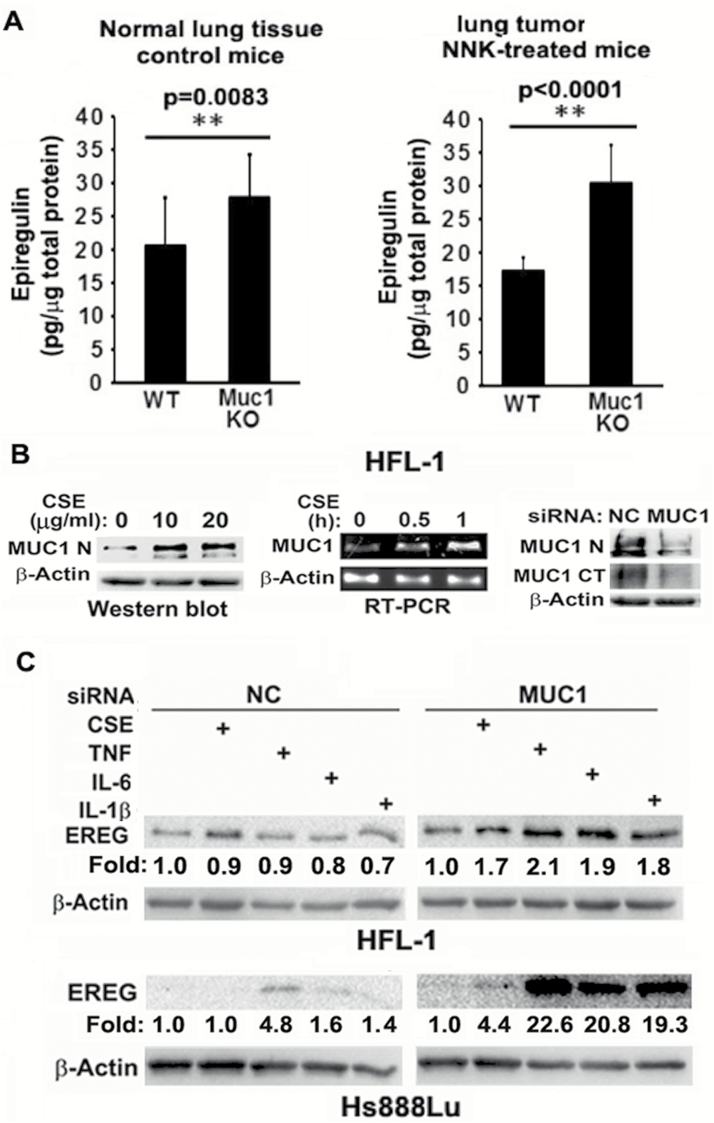
Figure 3.
MUC1 is expressed and contributes to EREG expression in fibroblasts. (A) Normal lung tissues from seven control WT and seven Muc1 KO mice and tumor tissues from seven NNK-treated WT and seven Muc1 KO mice were used to determine EREG concentration by ELISA assay. Ten micrograms of total protein from each sample was loaded to each well. Data shown are mean ± S.D; **P < 0.01. (B) Left, HFL-1 cells were treated with CSE (0, 10 and 20 µg/ml TPM) overnight. MUC1 expression was detected by Western blot. β-Actin was detected as an input control. Middle, HFL-1 cells were treated with CSE (20 µg/ml TPM) for the indicated time points. MUC1 mRNA level was detected by RT-PCR. β-Actin was detected as an input control. Right, HFL-1 cells were transfected with MUC1 siRNA or negative control siRNA for 48 h. MUC1 expression was detected by Western blot with antibody Muc1 GP1.4 against the extracellular domain (MUC1-N) and antibody MUC1 Ab-5 recognizing the C-terminal domain (MUC1-CT). β-Actin was detected as an input control. (C) HFL-1 and Hs888Lu cells were transfected with MUC1 siRNA or negative control siRNA for 24 h, before the cells were treated with CSE (20 µg/ml TPM), TNF-α (10 ng/ml), IL-6 (10 ng/ml) and IL-1β (10 ng/ml) overnight. EREG expression was detected by Western blot. β-Actin was detected as an input control. The intensity of the individual bands was quantified and normalized to the corresponding input control bands. Fold changes were calculated with the control taken as 1.

