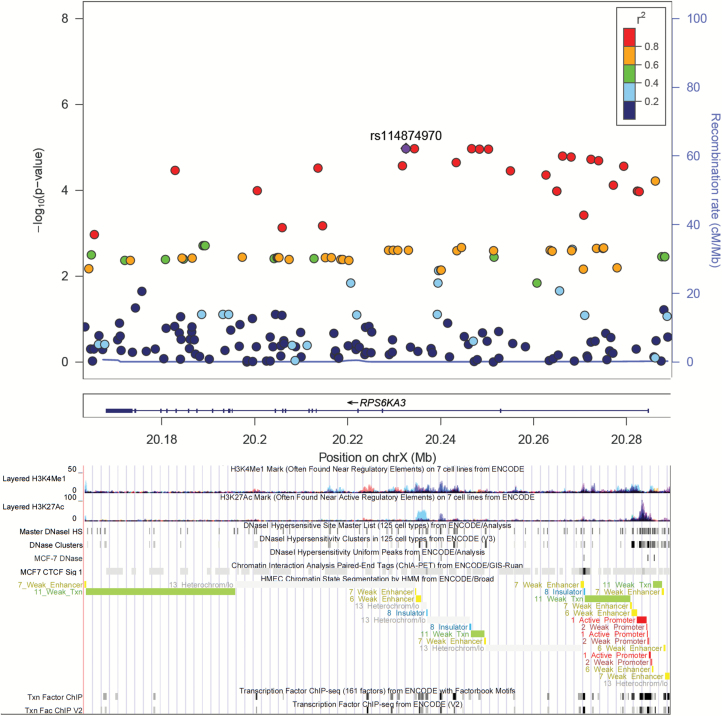
Figure 2.
Plot of log-transformed P values from single marker analysis for RPS6KA3 in ER− subgroup test (generated using the LocusZoom program). The labeled marker with rs# was the most significant SNP (index SNP), and the LD between other markers in the gene and the index SNP was color coded, with red color indicating strong LD (r2 > 0.8) and blue color indicating weak LD (r2 < 0.2). For the bottom part, analysis of regulation enhancer with data from ENCODE through UCSC Genome Browser, including histone modification marks for H3K4Me1 and H3K27Ac of seven cell types, transcription factor binding sites and DNase hypersensitivity sites of human mammary epithelial cells (HMEC), breast cancer cells (MCF7). Chromosomal coordinates are in NCBI build 37.

