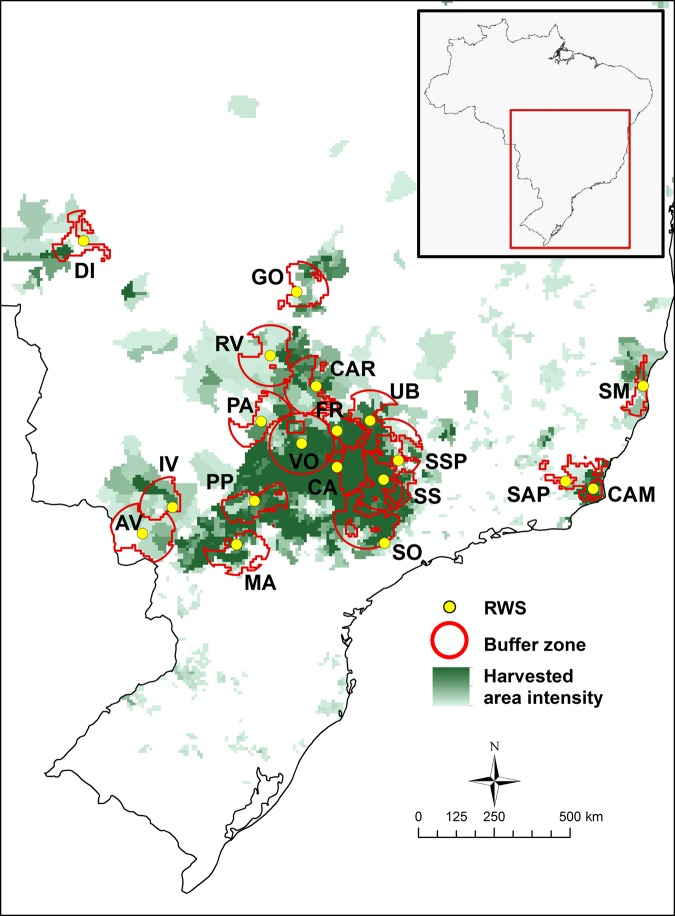
Figure 2.
The spatial distribution of reference weather stations (RWS) and associated buffers selected for the simulation of sugarcane water-limited yield potential in Brazil. Location codes for station names are provided in tables 1 and 2. The data on crop management, soil properties, and actual yield data were collected to represent sugarcane production within each RWS buffer. Sugarcane harvested area (in hectares) is shown in green and is based on recent (2006–2010) municipality-level statistics. The inset shows the location of the study area within Brazil. Abbreviation: km, kilometers.

