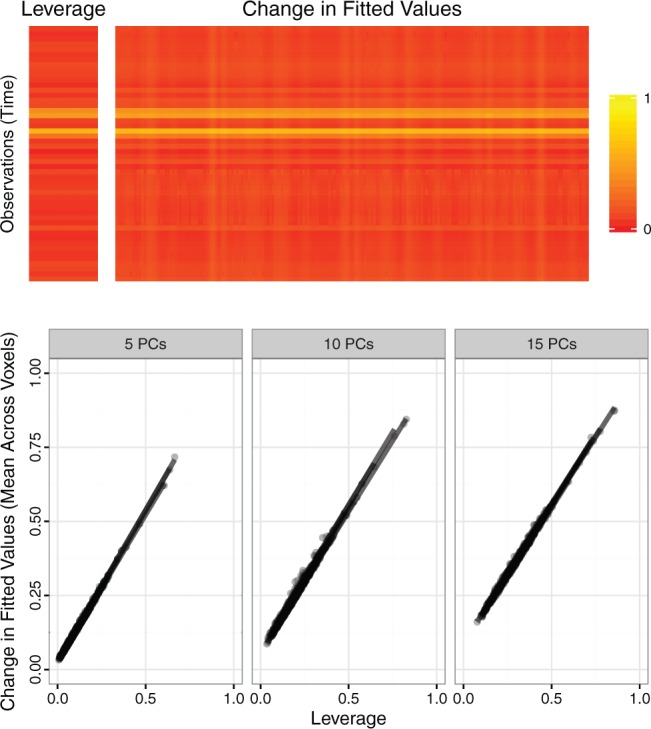
Fig. 1.

Top panel. For one randomly sampled subject, 50 contiguous time points and 200 contiguous voxels were randomly selected. For the resulting dataset  , five PCs were identified, and PCA leverage was computed for each time point
  , displayed in the column on the left. After centering and scaling
  , each observed value
  was increased by one unit and PCs and scores recomputed. The matrix displayed on the right shows the resulting change in the fitted value
  , where
  . Although some variation is seen across voxels, the observed change in fitted values is overall quite similar to the leverage. Other randomly sampled subjects show similar patterns, supporting the analogy with regression (where the relationship is exact) and the concept of PCA leverage as a measure of influence in PCA. Bottom panel. We performed the analysis described above for
  randomly sampled subjects, then computed the average change in fitted values across voxels. We performed the analysis with
  ,
,  and
and  PCs retained. The plot displays the PCA leverage and average change in fitted values for each subject, as well as a linear smoother across subjects. PCA leverage and the average change in fitted values are nearly equal, again supporting PCA leverage as a measure of influence in PCA.
