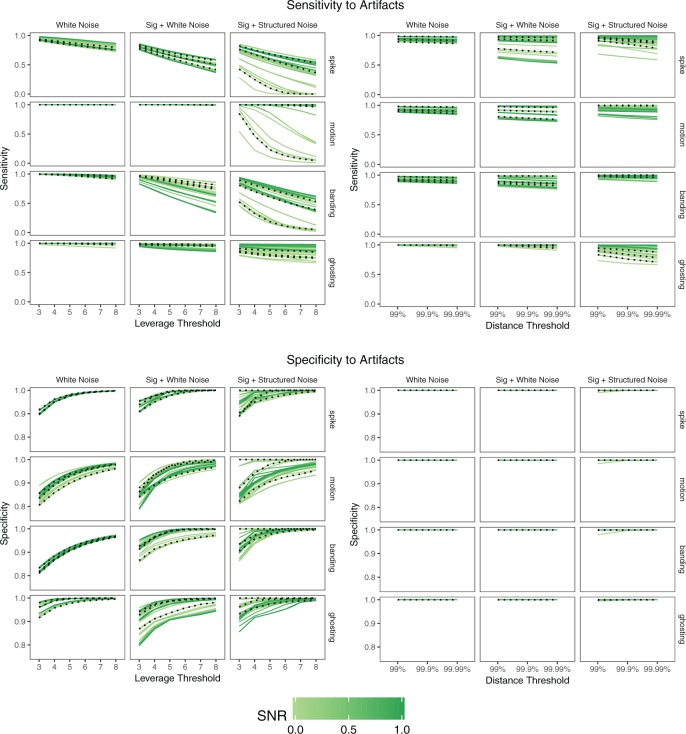
Fig. 4.
Sensitivity and specificity of each method in the presence of artifacts by simulation setup. Each line shows the mean across 1000 iterations for a given scan  and SNR. The dotted lines correspond to SNR of 0.05, which is close to the observed SNR of the fMRI scans used to construct the simulated scans.

