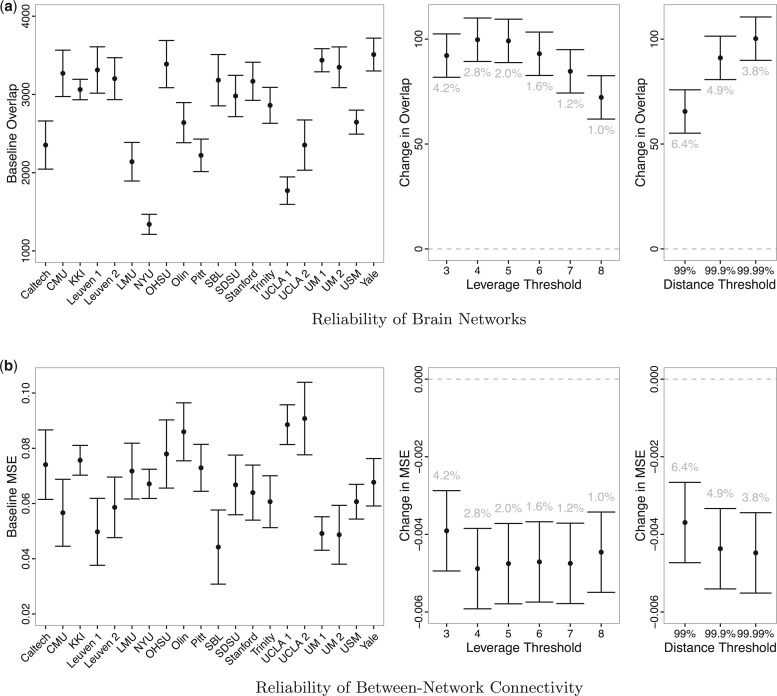
Fig. 6.
Estimates and 95% confidence intervals for the model coefficients for (a) the scan-rescan overlap of brain networks and (b) the scan-rescan MSE of connectivity between each network. For both models, the left-hand plot displays the fixed effects for each dataset ( ) and illustrates the heterogeneity in reliability across datasets in ABIDE before outlier detection. The middle and right-hand plots display the coefficients for each outlier removal method (
 ), which represent the change in reliability due to outlier removal. These plots also show the percentage of volumes in each fMRI run labeled as outliers using each method. Both leverage and robust distance-based outlier removal methods result in a statistically significant improvement to reliability of brain networks and connectivity. While both methods appear to be fairly robust to the choice of threshold, reliability is maximized by choosing a cutoff of
  times the median for PCA leverage and the
  th quantile for PCA robust distance.

