
Fig. 2.
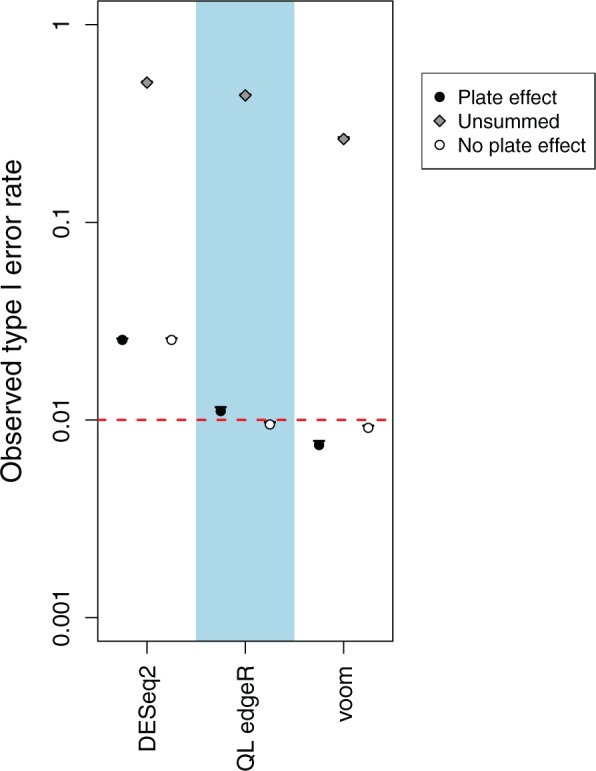
Observed type I error rate for each method after summation in simulations with and without a plate effect. Error rates are shown on a log scale and represent the average across 10 simulation iterations. Error bars represent standard errors, and the threshold of 0.01 is represented by the dashed line. The observed type I error rate for each method without summation is also shown for comparison.