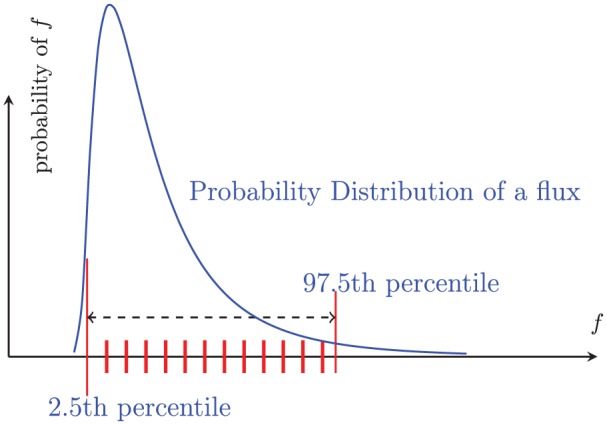
Figure 3.

An example of “importance sampling.” The blue curve is a sampling distribution of a flux f. To estimate the range of fluxes resulting from a sample, we calculate fluxes dependent on f using the red tick marks, which are equally spaced from 2.5th percentile to the 97.5th percentile.
