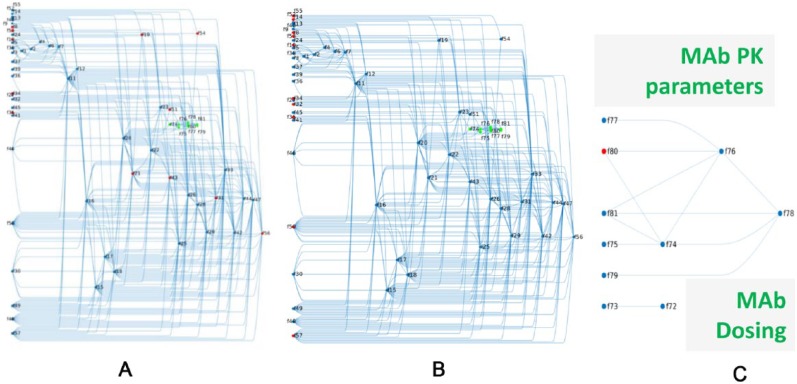
Figure 4.
From the original set of identified virtual patient–defining parameters, LIFE method determines a core set of parameters which control this variability in the model. The Quantitative Systems Pharmacology model of cholesterol synthesis can be represented as a network of fluxes (f’s). The null-space defines a connectivity matrix between all reaction rates (f’s) of the model and the core f’s controlling the variability in the model. (A) highlights (in red) the 12 reaction rates originally identified to define virtual patients within this network context. (B) shows core fluxes (in red) used to control variability in network approach. The target-mediated drug disposition model of anti-PCSK9 inhibitor is incorporated into the model (green nodes) and is shown in isolation in (C). One flux was used to create variability in the PK portion of the model (shown in red). LIFE indicates Linear-In-Flux-Expressions; PK, pharmacokinetics.

