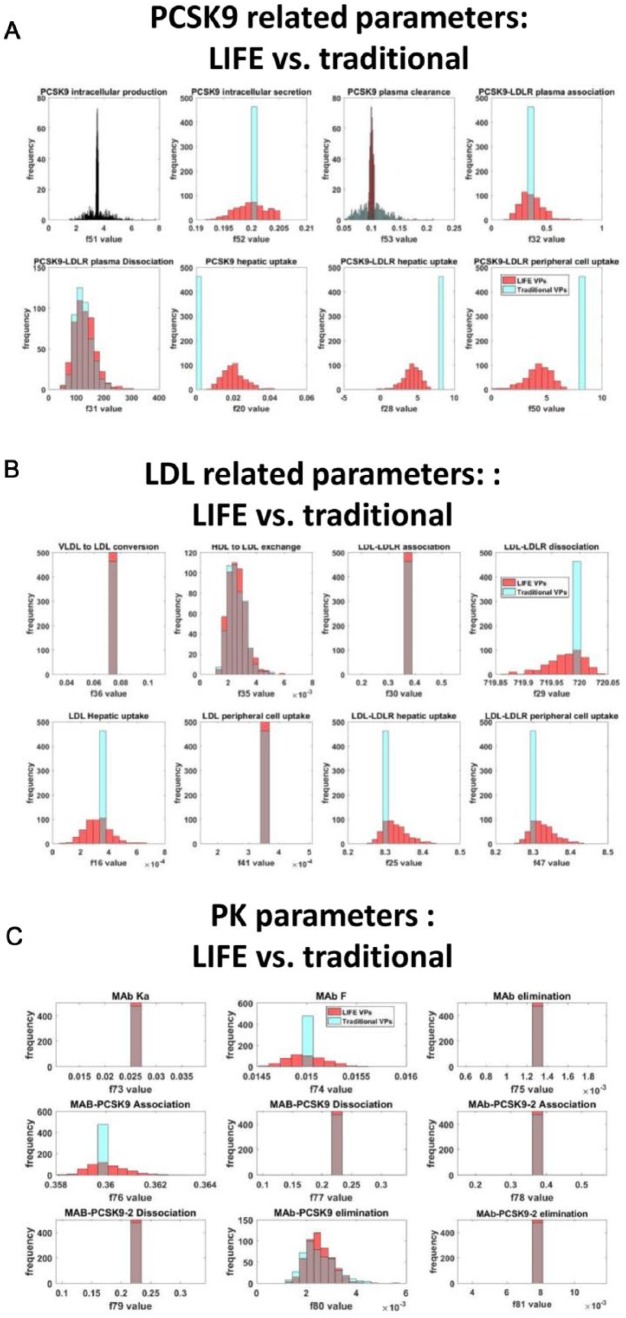
Figure 6.
The different VP approaches generate different levels of variability in key pathways of interest. Virtual populations based on the statin responder profile were created using the LIFE (red) and traditional (cyan) VP methods. Variability generated in (A) parameters controlling synthesis and clearance of PCSK9, (B) parameters controlling synthesis and clearance of LDL, and (C) pharmacokinetics-related parameters is shown. Unstable or unphysiological simulations (final LDL > 300 mg/dL) were excluded from plots. LDL indicates low-density lipoprotein; LDLR, low-density lipoprotein receptor; LIFE, Linear-In-Flux-Expressions, VP, virtual patient.

