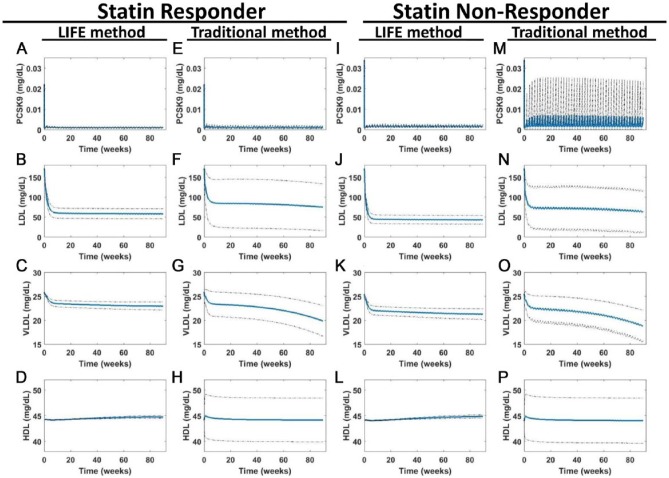
Figure 7.
LIFE methodology minimizes variability by taking covariance between parameters into account and creates populations with the same baseline values but different drug responses. Simulations were run to simulate 90 weeks of once every two weeks dosing with 150-mg anti-PCSK9 antibody. Predicted outputs are shown for (A-H) statin responder and (I-P) nonresponder populations, created by fluxes using the traditional or using the LIFE network approach. Plots show the mean (in blue) ± SD (dotted line) of the virtual patient responses generated from each simulation of (A, E, I, and M) PCSK9, (B, F, J, and N) LDL, (C, G, K, and O) VLDL, and (D, H, L, and P) HDL. Unstable or unphysiological simulations (with final LDL > 300 mg/dL) were excluded from plots. HDL indicates high-density lipoprotein; LDL, low-density lipoprotein; LDLR, low-density lipoprotein receptor; LIFE, Linear-In-Flux-Expressions; VLDL, very low-density lipoprotein.

