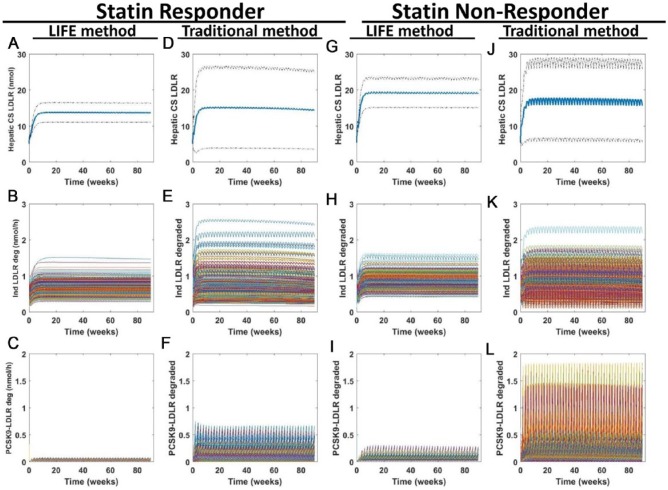
Figure 8.
Model predictions about LDLR again show increased variability predicted from simulations of a virtual population created using the traditional approach compared with the LIFE method. Simulations were run to simulate 90 weeks of once every two weeks dosing with 150-mg anti-PCSK9 antibody. Predicted outputs are shown for (A-F) statin responder and (G-L) nonresponder populations, created with (A-C, G-I) the LIFE approach or (D-F, J-L) the traditional approach. Plots of hepatic LDLR at the cell surface (A, D, G, and J) show the mean (in blue) ± SD of the VP responses generated from each simulation. Plots of the amount of LDLR degraded in the endosome per hour when isolated (B, E, H, and K) or in complex with PCSK9 (C, F, I, and L) show time courses for each VP. Unstable or unphysiological simulations (with final LDL > 300 mg/dL) were excluded from plots. LDL indicates low-density lipoprotein; LDLR, low-density lipoprotein receptor; LIFE, Linear-In-Flux-Expressions; VP, virtual patient.

