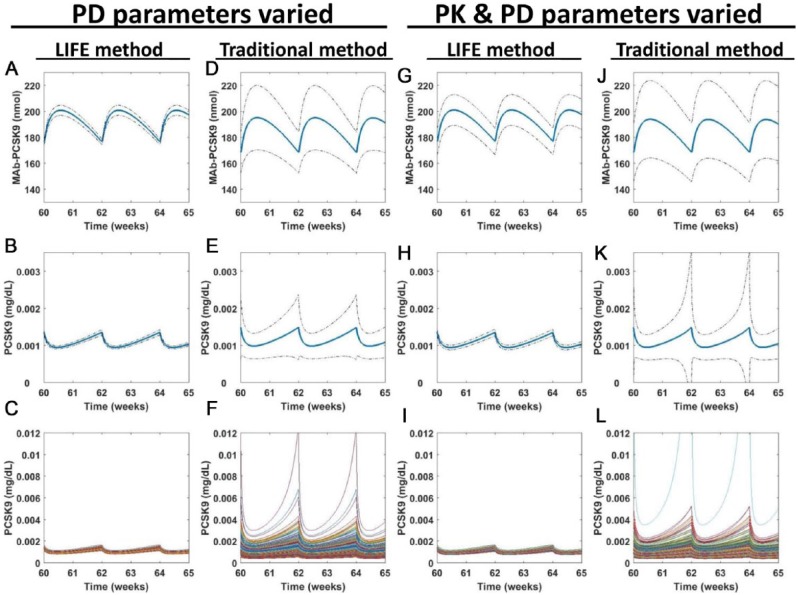
Figure 9.
Key model outputs are influenced by both PK and PD variability. Simulations were run after using either the traditional or the LIFE approach to generate parameter distributions for use in the model. Simulations were based on the typical statin responder profile. Parameters varied included (A-F) PD parameters only or (G-L) PD and PK parameters. The simulation was run over a period of 90 weeks. 2.5 stable cycles once every two weeks MAb dosing are shown, for simulated levels of (A, D, G, and J) MAb-PCSK9 in plasma and (B-C, E-F, H-I, and K-L) PCSK9 in plasma. The mean (blue) ± SD (dotted black lines) values are shown in plots (A-B, D-E, G-H, and J-K), whereas individual virtual patient predictions are overlaid on the same plot in (C, F, I, and L). Unstable or unphysiological simulations (with final LDL > 300 mg/dL) were excluded from plots. LDL indicates low-density lipoprotein; LIFE, Linear-In-Flux-Expressions; PD, pharmacodynamics; PK, pharmacokinetics.

