
Fig. 1.
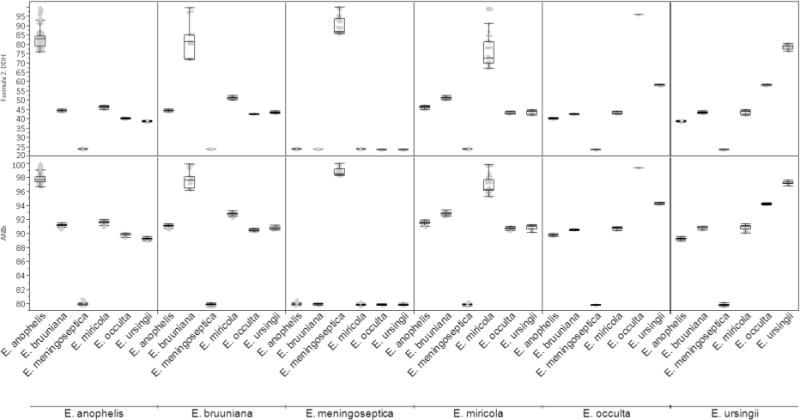
The variability of GGDC predicted DDH (top panel) and ANIb (lower panel) for pairwise comparisons is displayed, categorized based on the taxonomy assignments of each strain as described in this manuscript. Box-plots show the range and median of data for each comparison