
Fig. 3.
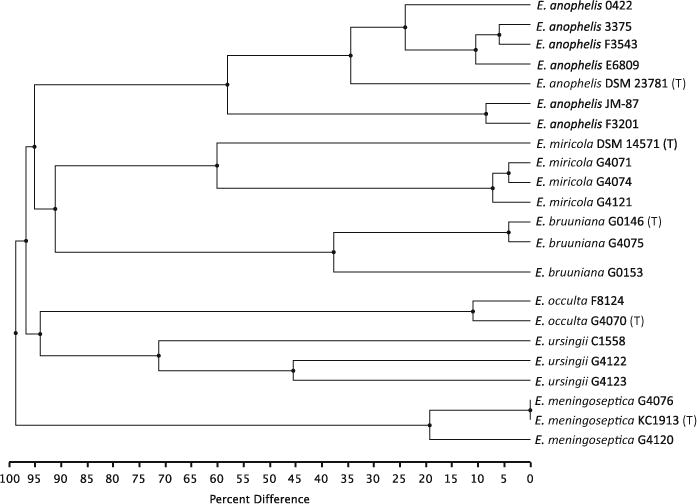
UPGMA based on optical maps. The percentage of restriction sites in common between optical maps of each isolate are indicated under the tree
Official websites use .gov
A
.gov website belongs to an official
government organization in the United States.
Secure .gov websites use HTTPS
A lock (
) or https:// means you've safely
connected to the .gov website. Share sensitive
information only on official, secure websites.
UPGMA based on optical maps. The percentage of restriction sites in common between optical maps of each isolate are indicated under the tree