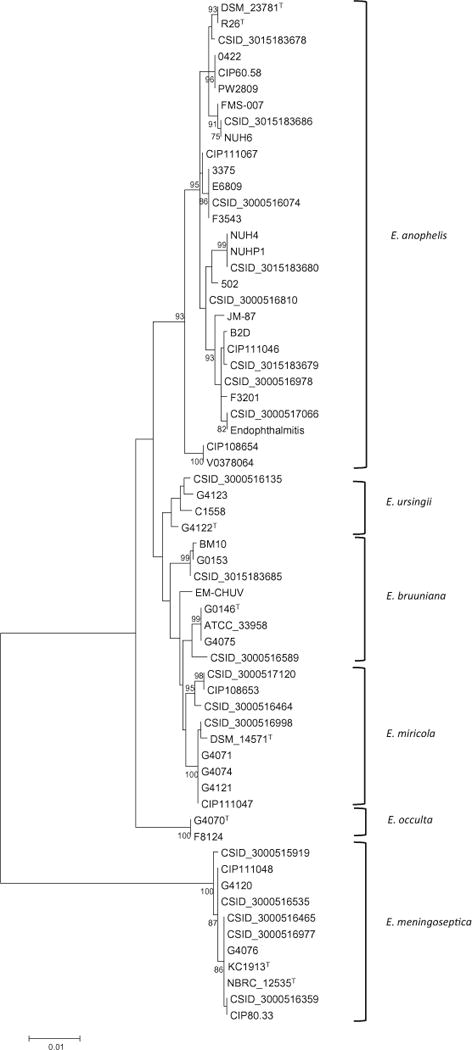
Fig. 4.

Molecular phylogenetic analysis of positions 1939-3629 from the rpoB gene. The evolutionary history was inferred by using the Maximum Likelihood method based on the JC69 model. The tree with the highest log likelihood is shown, and the percentage of trees in which the associated taxa clustered together is shown next to the branches, based on 100 bootstrap replicates. Bootstrap values greater than 70% are displayed. Branch lengths show the number of substitutions per site. The analysis involved 63 nucleotide sequences, and gaps were eliminated, yielding a total of 1690 nucleotide positions
