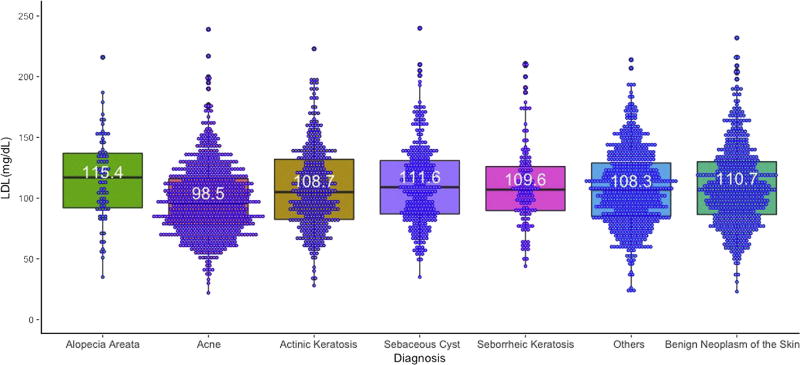
Figure 2.
LDL levels in female patients. Patients are grouped by dermatological diagnoses, excluding patients with multiple dermatological diagnoses. Box plots are generated for each group, with lower and upper border representing the 25th and 75th percentile, respectively; the middle line within each box plot represents the median level of LDL (mg/dl). Dot plots are superimposed to show individual measurements. Mean levels of LDL (mg/dl) are displayed over the dot and box plots. Sample size for each group is shown in legends. LDL, low-density lipoprotein.

