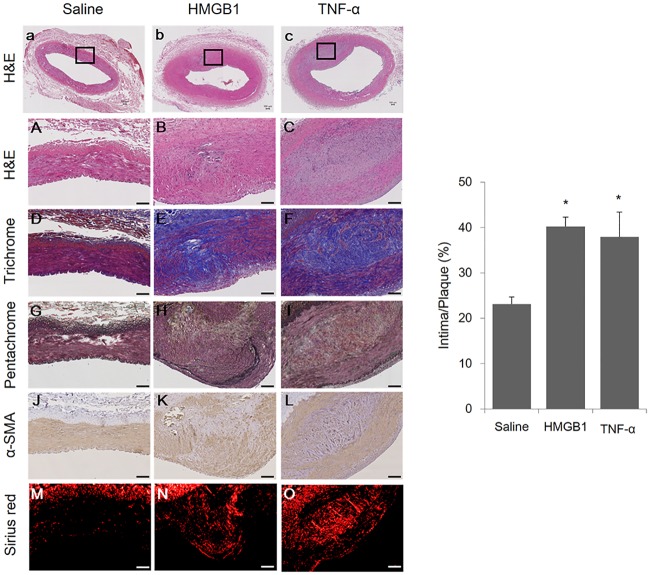
Fig 1. Analysis of morphologic changes in arteries of mini-pigs with induced atherosclerosis.
The α-SMA content of the arteries was detected by IHC staining of α-SMA; the collagen content of the plaques is represented by Sirius red staining visualized under polarized light. Representative images of plaques injected with either saline (n = 11), HMGB1 (n = 11), and TNF-α (n = 10) as indicated and stained with hematoxylin & eosin (H&E) (a-c [20× of A-C]), Masson’s trichrome (D-F), Masson’s pentachrome (G-I), α-SMA (J-L), and Sirius red (M-O) (100×). Black boxes in a, b, and c represent the areas further magnified in A-O corresponding to their respective columns. IHC area was calculated as (intima/plaque) × 100, %. Scale bars represent 100 μm. The intima-plaque ratio data are represented as the mean±SEM. *p<0.05, compared with the saline group.

