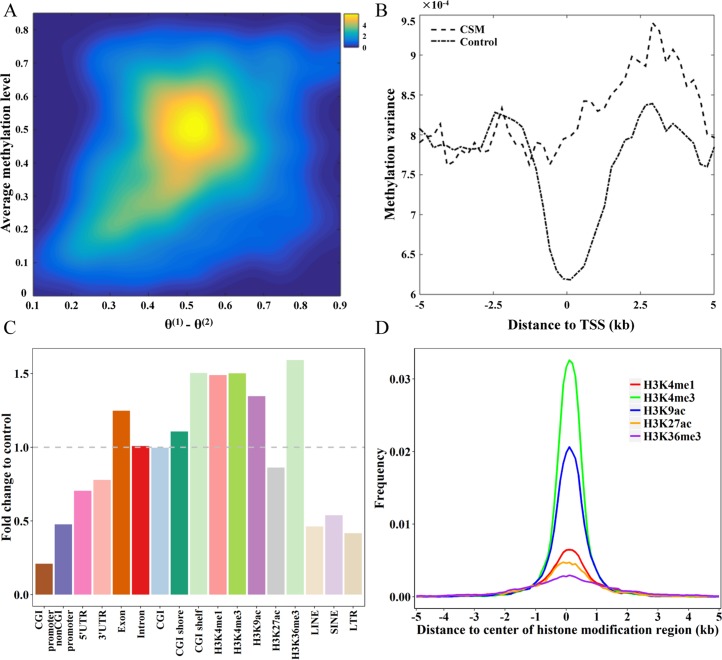
Fig 3. Characteristics of putative CSM loci.
(A) Density scatterplot of θ(1)—θ(2) (x-axis) and the average methylation level (y-axis) of putative CSM loci across 19 cells. The coloring indicates the density of putative CSM loci from low (blue) to high (yellow). (B) The methylation variance in putative CSM loci and control regions in 5kb flanking regions of TSS. (C) The fold change in the distribution of putative CSM loci across various genomic features compared to those of control regions. (D) The frequency of putative CSM loci distributed in the 5kb regions flanking the center of histone marks of H3K4me1, H3K4me3, H3K27ac, H3K9ac and H3K36me3.

