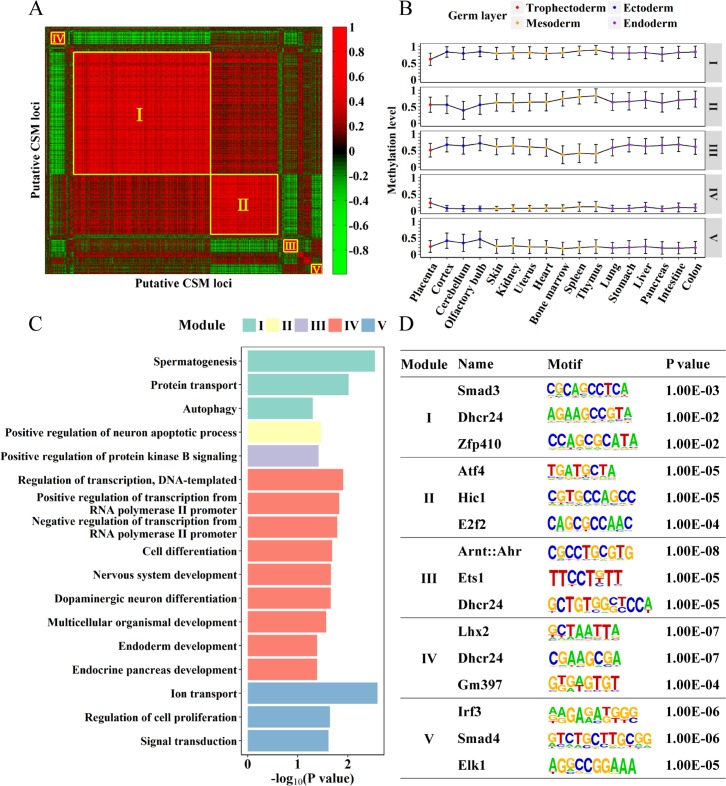
Fig 4. Co-methylation and co-regulation of putative CSM loci.
(A) Heatmap of pair-wise Pearson’s correlations of putative CSM loci according to their methylation levels in 17 mouse tissues, with top five co-methylated modules marked. (B) The methylation profiles of the top five modules in the 17 mouse tissues, with circle showing the average methylation level, and the error bar showing the standard deviation. Tissues deriving from different germ layers are marked. (C) The significance of GO terms enriched for each module. P values were reported using NCBI DAVID annotation tool and scaled to–log10 based. (D) Top three TF motifs enriched in each module. P values were determined using Homer software.

