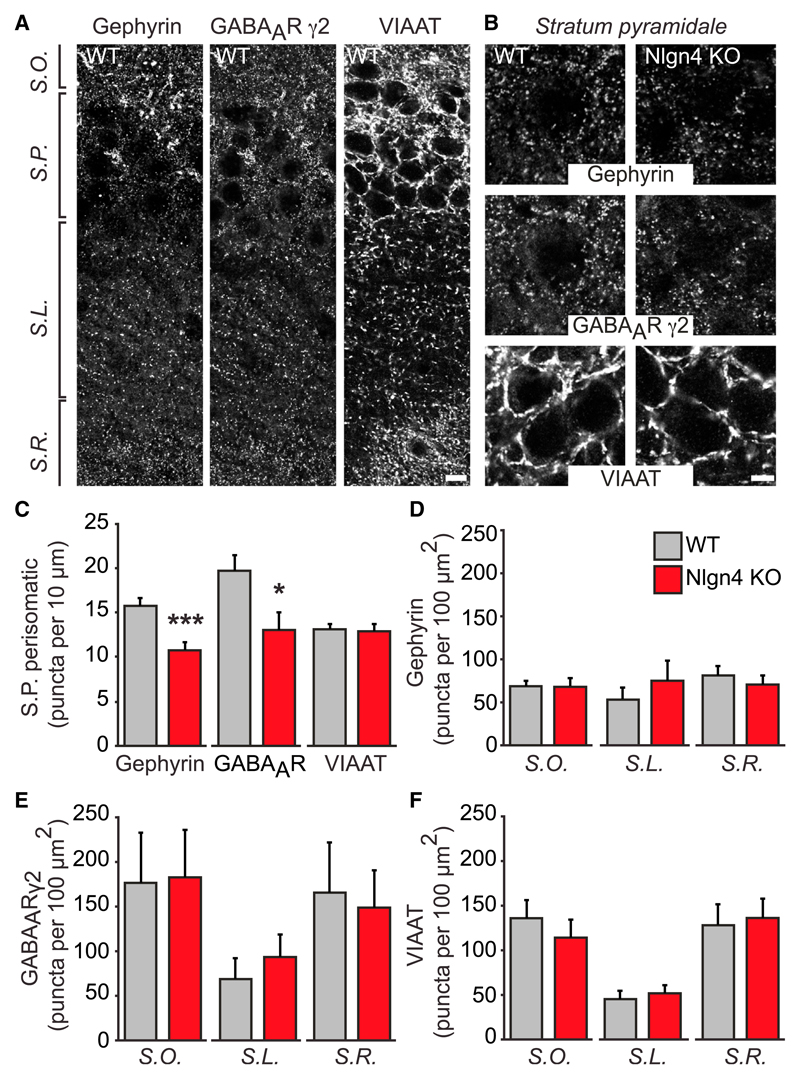
Figure 2. Inhibitory Synapses in the CA3 Stratum Pyramidale of Nlgn4 KOs.
(A) Images show GPH, GABAARγ2, and VIAAT immunoreactivity in CA3 of WT mice. Scale bar, 10 μm.
(B) High-magnification images show GPH, GABAARγ2, and VIAAT immunoreactivity in CA3 stratum pyramidale of WT and Nlgn4 KO mice. Scale bar, 5 μm.
(C) Quantification of GPH, GABAARγ2, and VIAAT puncta in the perisomatic area of pyramidal cells in CA3 is shown (puncta per 10 μm perimeter).
(D–F) Quantifications of GPH (D), GABAAR γ2 (E), and VIAAT (F) puncta in the stratum oriens, stratum lucidum, and stratum radiatum of CA3 are shown (puncta per 100 μm2).
S.O., stratum oriens; S.P., stratum pyramidale; S.L., stratum lucidum; S.R., stratum radiatum. Error bars represent SEM; n = 12 pairs of mice; *p < 0.05, ***p < 0.001.

