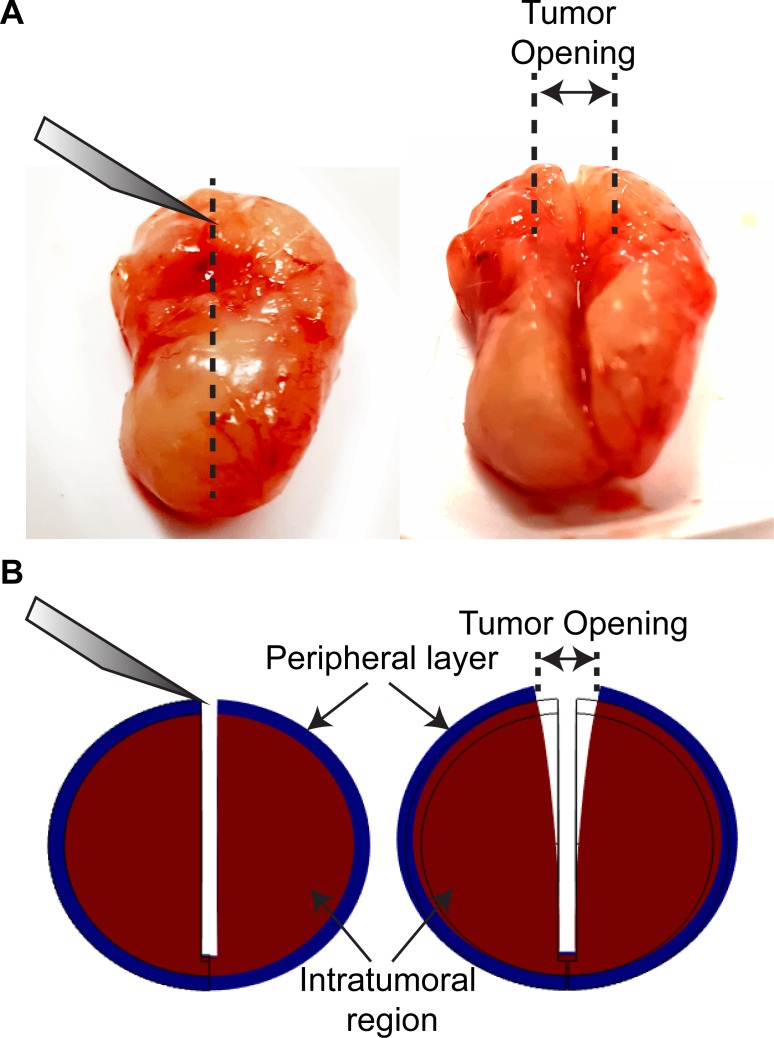
Fig 1. Schematic of tumor opening experiment and calculations.
A: Typical experimental procedure showing the tumor before and after the cut has been made. The measured tumor opening appears in the figure. B: Representative computational results in the beginning and at the end of the simulation. In the model, the tumor consists of two domains, the tumor and a peripheral layer with thickness 5% of the tumor diameter. The simulations were used for the calculation of the growth-induced stress from the measured displacement/opening of the tumor.

