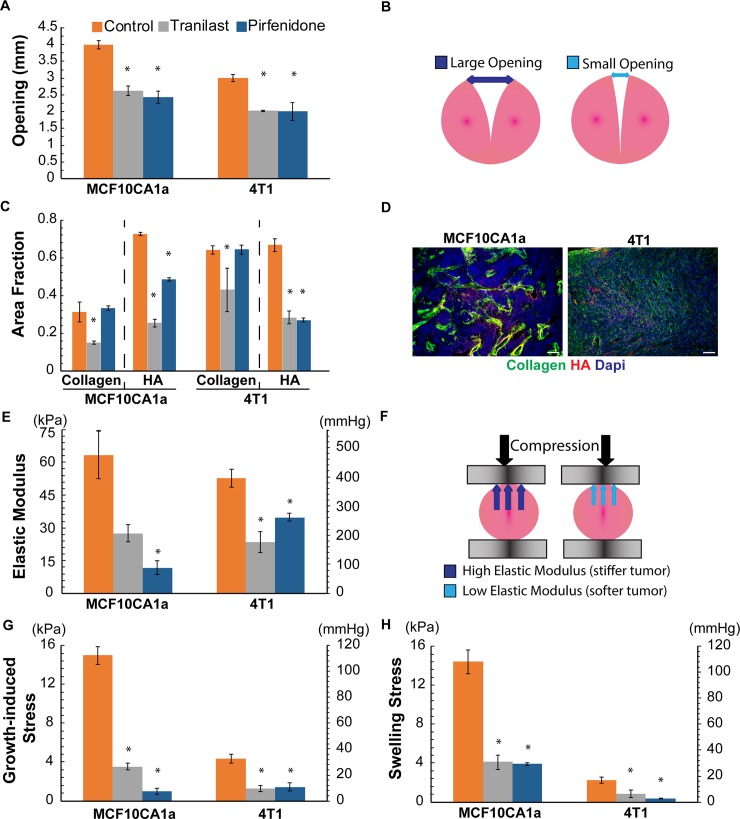
Fig 3. Experimental measurements and calculations for MCF10CA1a and 4T1 tumors.
A: Tumor opening experimental data for the control and the two treated groups. B: Schematic of the tumor opening measurement, C: Area fraction quantification of collagen and hyaluronan (HA), D: Representative immunofluorescent images for collagen, HA and DAPI (scale bar:100μm). E: Elastic Modulus experimental data for the two tumors and the different groups employed. F: Schematic of mechanical measurements, high and low modulus is associated with stiffer and softer tumors, respectively, G: Growth-induced stress calculated using mathematical modeling, H: Swelling stress calculated from the ratio of hyaluronan to collagen content using Eq 4. Error bars represent the standard error.

