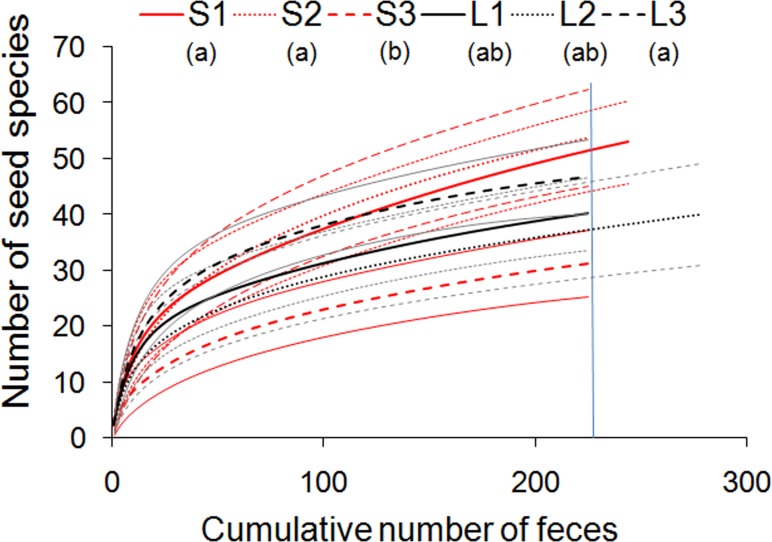
Fig 1. Sample-based rarefaction curves of the seed species richness dispersed by brown howlers in three small (thick red lines) and three large (thick black lines) Atlantic forest fragments.
Dashed and fine lines show 95% confidence intervals. Blue vertical line shows the species richness for the rarified number of fecal samples (n = 225). We used 95% confidence intervals of the moment-based estimator to compare the richness of dispersed seeds among groups [38]. Different lower case letters in parentheses indicate significant between-group differences.

