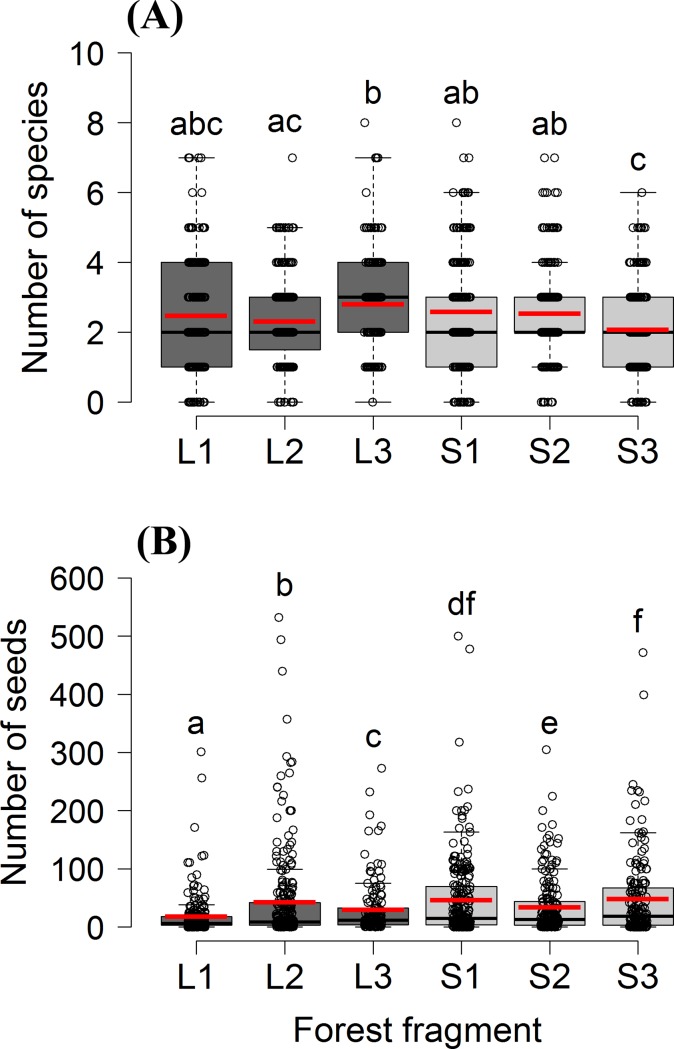
Fig 2.
Total richness of seed species (A) and the abundance of seeds >2 mm (B) at the fecal sample level. The line within a box represents the median, the red line represents the mean, the box represents the range between the first and third interquartiles (IQR), and the whiskers represent the IQR multiplied by 1.5. Dots represent the fecal samples for each fragment. Boxes sharing no letter are significantly different (contrast tests, p<0.05).

