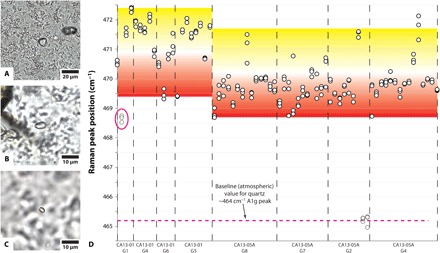
Fig. 3. Quartz-in-garnet Raman microspectroscopy results.

(A to C) Transmitted-light photomicrographs of some analyzed quartz inclusions in garnet. (D) Positions for the nominally 464 cm−1 A1g Raman peak for quartz inclusions in garnet from Ring Mountain, analyzed in triplicate. Inclusion circled in pink displays an abnormally low peak position despite lack of evidence that it was exposed during polishing or associated with visible cracks in garnet. Yellow-to-red background coloring is shown for reference to spot colors on garnet x-ray count maps in Fig. 1.
