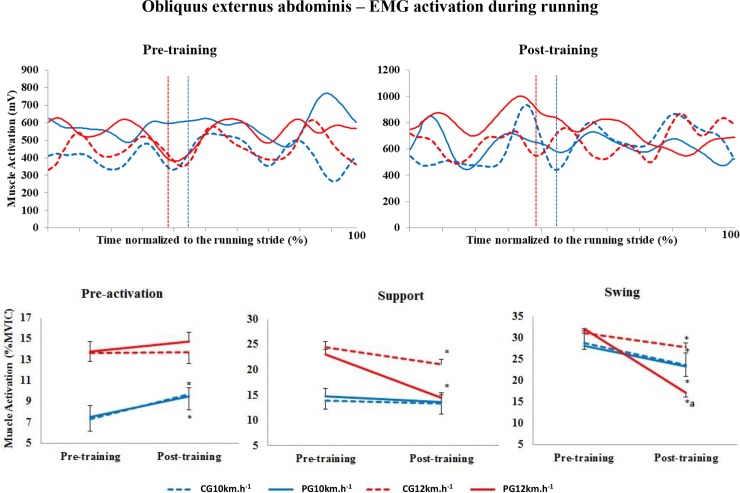
Fig 1. Upper panels, mean pattern of activation of the obliquus externus abdominis muscle (mV).
Lower panels, mean (± standard error) muscle activation in the three stride phases, presented as a percentage of the MVIC. Red lines represent 12 km.h-1, and blue lines represent 10 km.h-1. Dotted lines represent the control group (CG), and solid lines represent the Pilates group (PG). The vertical dotted lines indicate the end of the contact phase. * Significant difference between pre- and post-training; a significant difference between groups (p<0.005).

