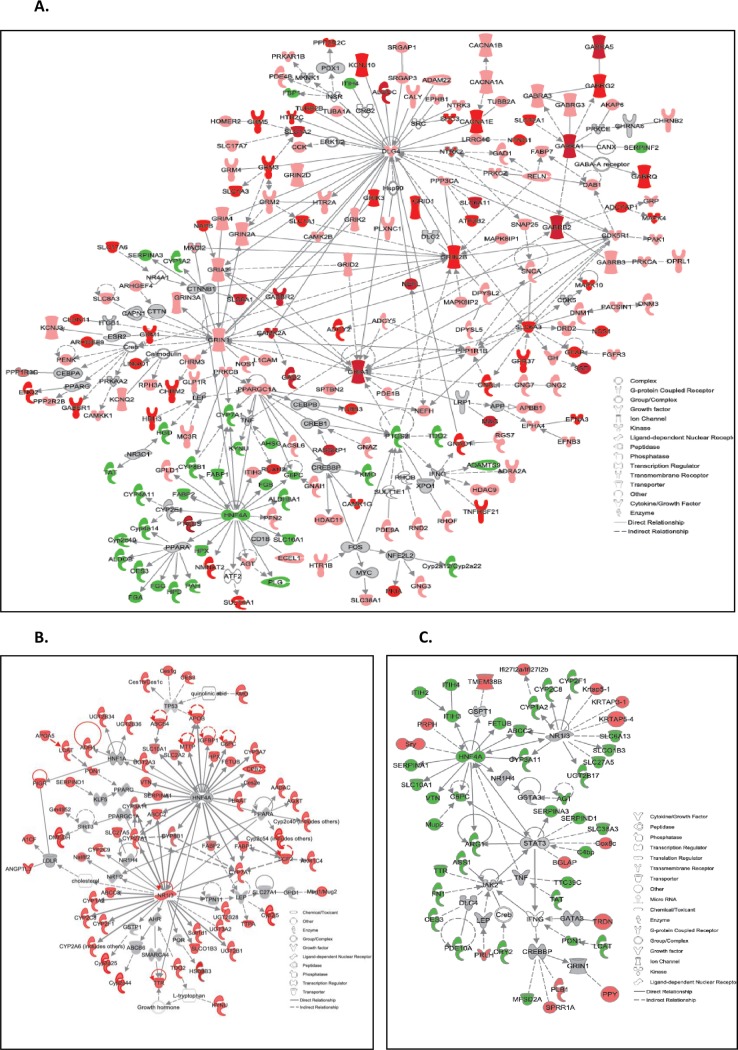
Fig 5.
Functional relationship gene networks representing adrenal DEGs in response to (A) ASP exposure (B) developmental antagonism with CGP and (C) ASP + CGP. Red and green color indicates upregulation and downregulation of the genes, respectively and intensity of the color reflects the extent of its differential expression. Only DEGs with ≥±1.8-fold change relative to CON are depicted, P≤0.05).

