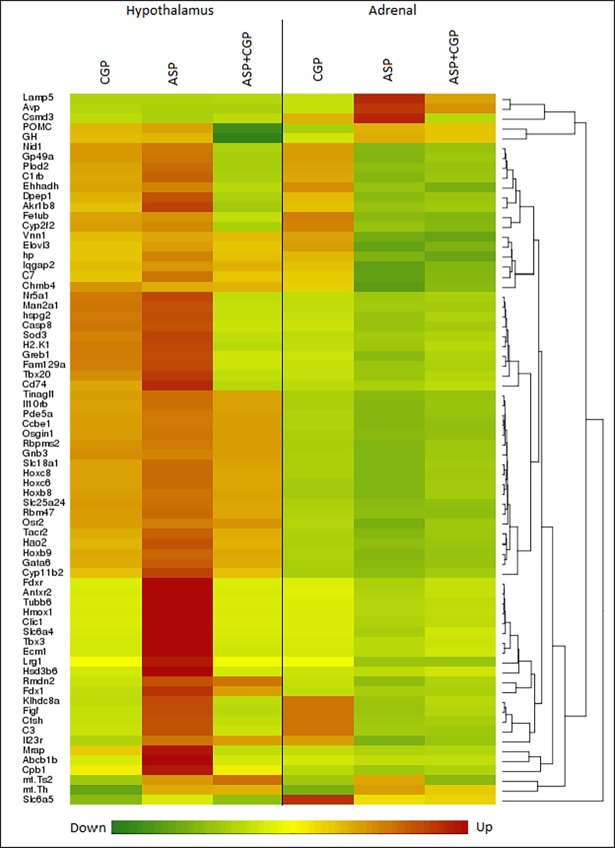
Fig 6. 72 differentially expressed genes common to hypothalamus and adrenal glands were hierarchically clustered and illustrated in a heat map (stringency ≥±1.4 fold change in expression, P<0.05).
Expression levels are represented by a color scale from green (low) to red (high) indicated at the bottom of the heatmap. CGP denotes developmental NMDAR antagonism with CGP 39551. ASP denotes chronic aspartame exposure. ASP+CGP denotes Aspartame exposure and developmental NMDAR antagonism with CGP 39551.

