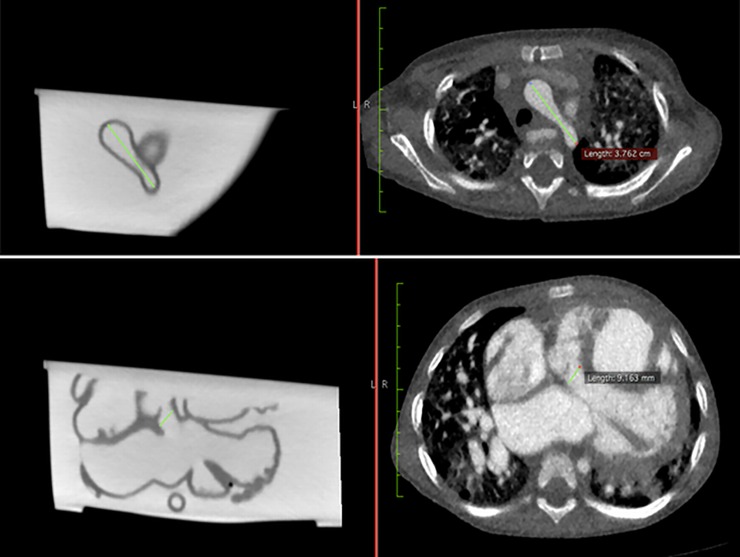
Fig 2. An example showing how measurements were taken at the aortic arch (top row) and ventricular septal defect (bottom row) using ruler function in Horos.
The left column images refer to contrast-enhanced CT images of the 3D printed model, while the right column images indicate original CCTA images.

