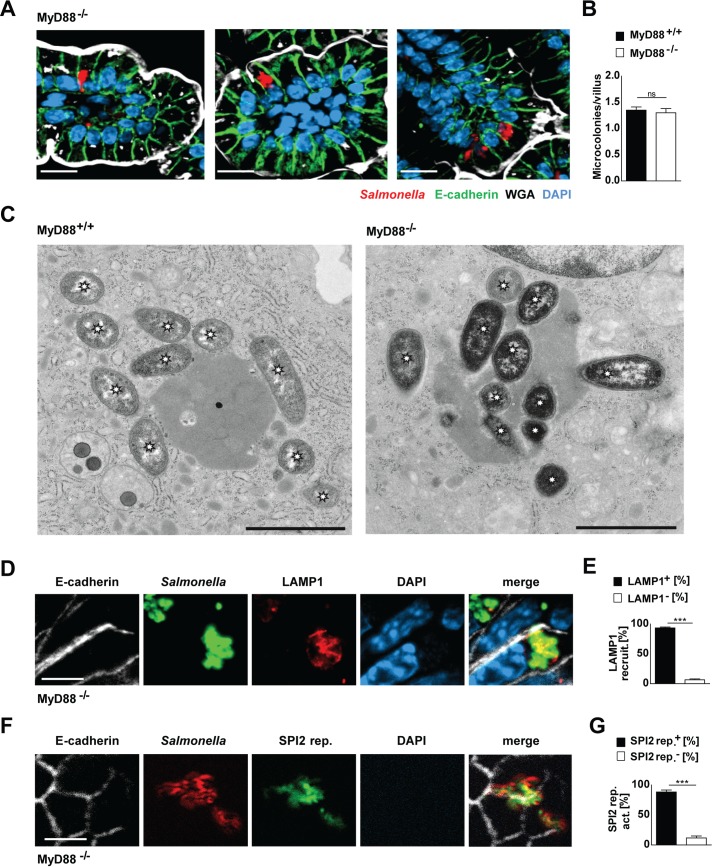
Fig 2. The influence of MyD88-dependent innate immune signaling on intraepithelial microcolony formation.
1-day-old MyD88+/+ and MyD88-/- mice were orally infected with 100 CFU S. Typhimurium WT. (A) 4 days after infection, small intestinal tissues were collected and analyzed by immunostaining. Three representative images showing S. Typhimurium (red) forming intraepithelial microcolonies in MyD88-/- mice. Counterstaining with E-cadherin (green), WGA (white) and DAPI (blue). Bar, 10 μm. For wild type controls see Fig 1D. (B) Quantitative evaluation of the number of intraepithelial microcolonies per villus in MyD88+/+ and MyD88-/- mice at 4 days p.i.. S. Typhimurium microcolonies were quantified in 20–30 villi per animal (n = 6–8). Results represent the mean ± SD. (C) Transmission electron microscopy (TEM) images of intraepithelial Salmonella in MyD88+/+ (left panel) and MyD88-/- mice (right panel). Asterisks highlight bacteria. Bar, 2 μm. (D) Co-immunostaining for Salmonella (green) and LAMP1 (red) in small intestinal tissue sections at day 4 p.i.. Counterstaining with E-cadherin (white) and DAPI (blue). Bar, 5 μm. (E) Quantitative evaluation of the percentage of intraepithelial S. Typhimurium associated with LAMP1 staining. Four neonates were analyzed at day 4 p.i.. Results represent the mean ± SD. (F) Co-immumostaining for Salmonella (red) and the GFP expressing SPI2 reporter (pM973, green) in small intestinal tissue sections at day 4 p.i.. Counterstaining with E-cadherin (white) and DAPI (blue). Bar, 5 μm. (G) Quantitative analysis of the percentage of intraepithelial S. Typhimurium expressing the SPI2 reporter. Microcolonies from tissue sections from four neonates were analyzed at day 4 p.i.. Results represent the mean ± SD.

