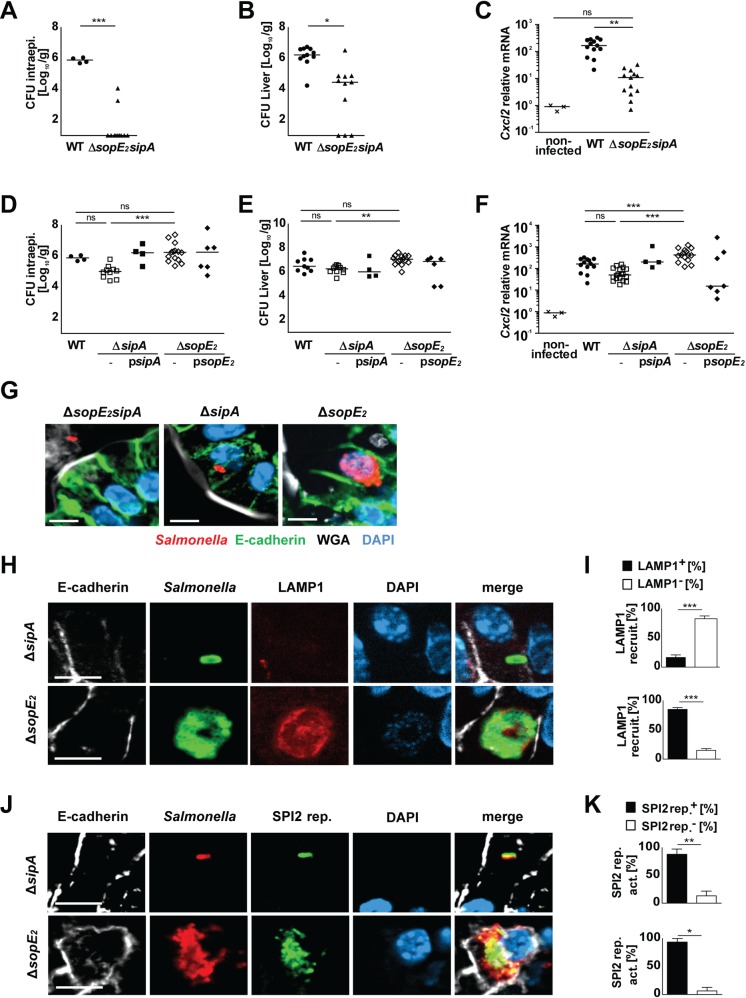
Fig 3. The redundant role of SipA and SopE2 for enterocyte invasion.
(A-C) 1-day-old C57BL/6 mice were orally infected with 100 CFU wild type (WT) (filled circles) or isogenic sopE2sipA mutant S. Typhimurium (filled triangles). Viable counts in (A) isolated gentamicin-treated enterocytes and (B) total liver tissue homogenate at 4 days p.i.. (C) Quantitative RT-PCR for Cxcl2 mRNA in total RNA prepared from enterocytes isolated at 4 days p.i.. Values were normalized to uninfected age-matched control animals (crosses). Individual values and the mean from at least two independent experiments are shown (n = 4–6 animals per group). The data for uninfected control animals and WT Salmonella infected mice are identical to Fig 1A–1C. (D-F) 1-day-old C57BL/6 mice were orally infected with 100 CFU WT (filled circles), isogenic sipA mutant (open squares), complemented ΔsipA psipA (filled squares), isogenic sopE2 mutant (open diamonds), or complemented ΔsopE2 psopE2 (filled diamonds) Salmonella. Viable counts in (D) isolated gentamicin-treated enterocytes and (E) total liver tissue homogenate at 4 days p.i.. (F) Quantitative RT-PCR for Cxcl2 mRNA in total RNA prepared from enterocytes isolated at 4 days p.i.. Values were normalized to uninfected age-matched control animals (crosses). Individual values and the mean from at least two independent experiments are shown (n = 3–5 animals per group). The data for uninfected control animals and Salmonella WT infected mice are identical to Fig 1A–1C. (G) Immunostaining for S. Typhimurium (red) in small intestinal tissue sections at 4 days p.i. with 100 CFU ΔsopE2sipA, ΔsipA, or ΔsopE2 S. Typhimurium Salmonella. Counterstaining with E-cadherin (green), WGA (white) and DAPI (blue). Bar, 5 μm. (H) Co-immunostaining for Salmonella ΔsipA, ΔsopE2 (green) and LAMP1 (red) in small intestinal tissue sections at day 4 p.i.. Counterstaining with E-cadherin (white) and DAPI (blue). Bar, 5 μm. (I) Quantitative evaluation of the percentage of intraepithelial S. Typhimurium associated with LAMP1 staining. All microcolonies from three tissue sections per infected neonate were analyzed (n = 5) at day 4 p.i.. Results represent the mean ± SD. (J) Co-immunostaining for Salmonella ΔsipA or ΔsopE2 (red) and the GFP-expressing SPI2 reporter (pM973; green) in small intestinal tissue sections at day 4 p.i.. Counterstaining with E-cadherin (white) and DAPI (blue). Bar, 5μm. (K) Quantitative analysis of the percentage of intraepithelial S. Typhimurium expressing the SPI2 reporter. All microcolonies from three tissue sections per infected neonate were analyzed (n = 3) at day 4 p.i.. Results represent the mean ± SD.

