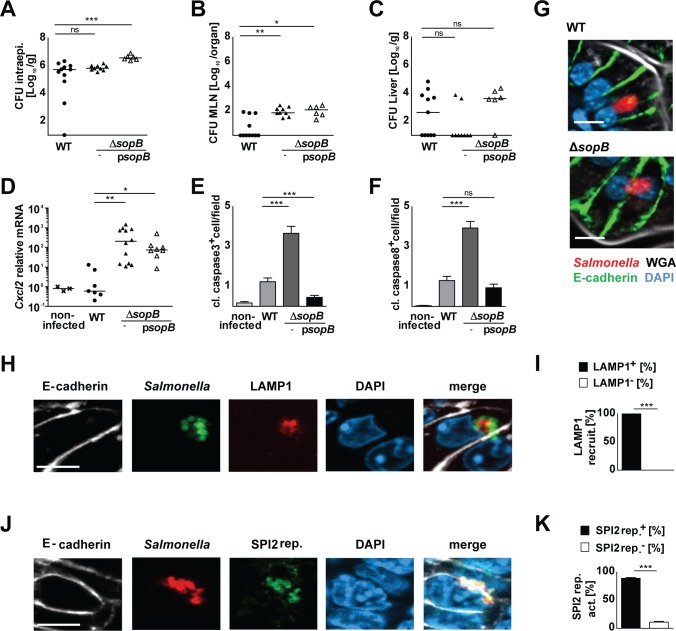
Fig 5. The role of SopB in the interaction between Salmonella and the epithelium.
1-day-old C57BL/6 mice were orally infected with 100 CFU wild type (WT) (filled circles), isogenic sopB mutant (filled triangles), or psopB-complemented ΔsopB (open triangles) S. Typhimurium. Viable counts in (A) isolated gentamicin-treated enterocytes, (B) total MLN and (C) total liver tissue homogenate at 2 days p.i.. (D) Quantitative RT-PCR for Cxcl2 mRNA in total RNA prepared from enterocytes isolated at 2 days p.i.. Values were normalized to uninfected age-matched control animals (crosses). Individual values and the mean from at least two independent experiments are shown (n = 3–5 animals per group). (E) Quantitative analysis of the number of cleaved caspase 3- and (F) cleaved caspase 8 positive cells per 200 times magnification image field. Positive cells from 20 image fields from one section were analyzed per infected neonate (n = 3–6) at day 3 p.i.. Results represent the mean ± SD. (G) Immunostaining for S. Typhimurium (red) in small intestinal tissue sections at 3 days p.i. with 100 CFU WT and ΔsopB S. Typhimurium. Counterstaining with E-cadherin (green), WGA (white) and DAPI (blue). Bar, 5 μm. (H) Co-immunostaining for ΔsopB S. Typhimurium (green) and LAMP1 (red) in small intestinal tissue sections at day 3 p.i.. Counterstaining with E-cadherin (white) and DAPI (blue). Bar, 5 μm. (I) Quantitative evaluation of the percentage of intraepithelial S. Typhimurium associated with LAMP1 staining. All microcolonies from three tissue sections per infected neonate were analyzed (n = 3) at day 3 p.i.. Results represent the mean ± SD. (J) Co-immumostaining for ΔsopB S. Typhimurium (red) and the GFP expressing SPI2 reporter (pM973; green) in small intestinal tissue sections at day 3 p.i.. Counterstaining with E-cadherin (white) and DAPI (blue). Bar, 5 μm. (K) Quantitative analysis of the percentage of intraepithelial S. Typhimurium expressing the SPI2 reporter. All microcolonies from three tissue sections per infected neonate were analyzed (n = 3) at day 3 p.i.. Results represent the mean ± SD.

