Figure 2. Salient experiences are represented by unique transcriptional signatures.
(A) Schematic of experimental paradigms. Experiences analyzed include saline (acute and repeated); foot shock (acute shock and no-shock controls exposed to the same environment); LiCl (acute and repeated); cocaine (acute, repeated and challenge following abstinence); sucrose (acute and repeated) and reinstatement of feeding (following 18 hr of deprivation). (B) Radar plots representing the transcriptional induction of Arc, Egr2, Egr4 and Fos across seven brain structures 1 hr after the different experiences [LCtx: limbic cortex (n = 4–14), NAc: nucleus accumbens (n = 4–14), DS: dorsal striatum (n = 4–14), Amy: amygdala (n = 4–9), LH: lateral hypothalamus (n = 3–9), Hipp: hippocampus (n = 4–9); VTA: ventral tegmental area (n = 2–8)]. Results are shown in log2 scale as mean ± s.e.m. of induction over baseline control.

Figure 2—figure supplement 1. Low variability of the individual transcriptional representations of recent experience.

Figure 2—figure supplement 2. Transcriptional representation of negative valence in the amygdala.
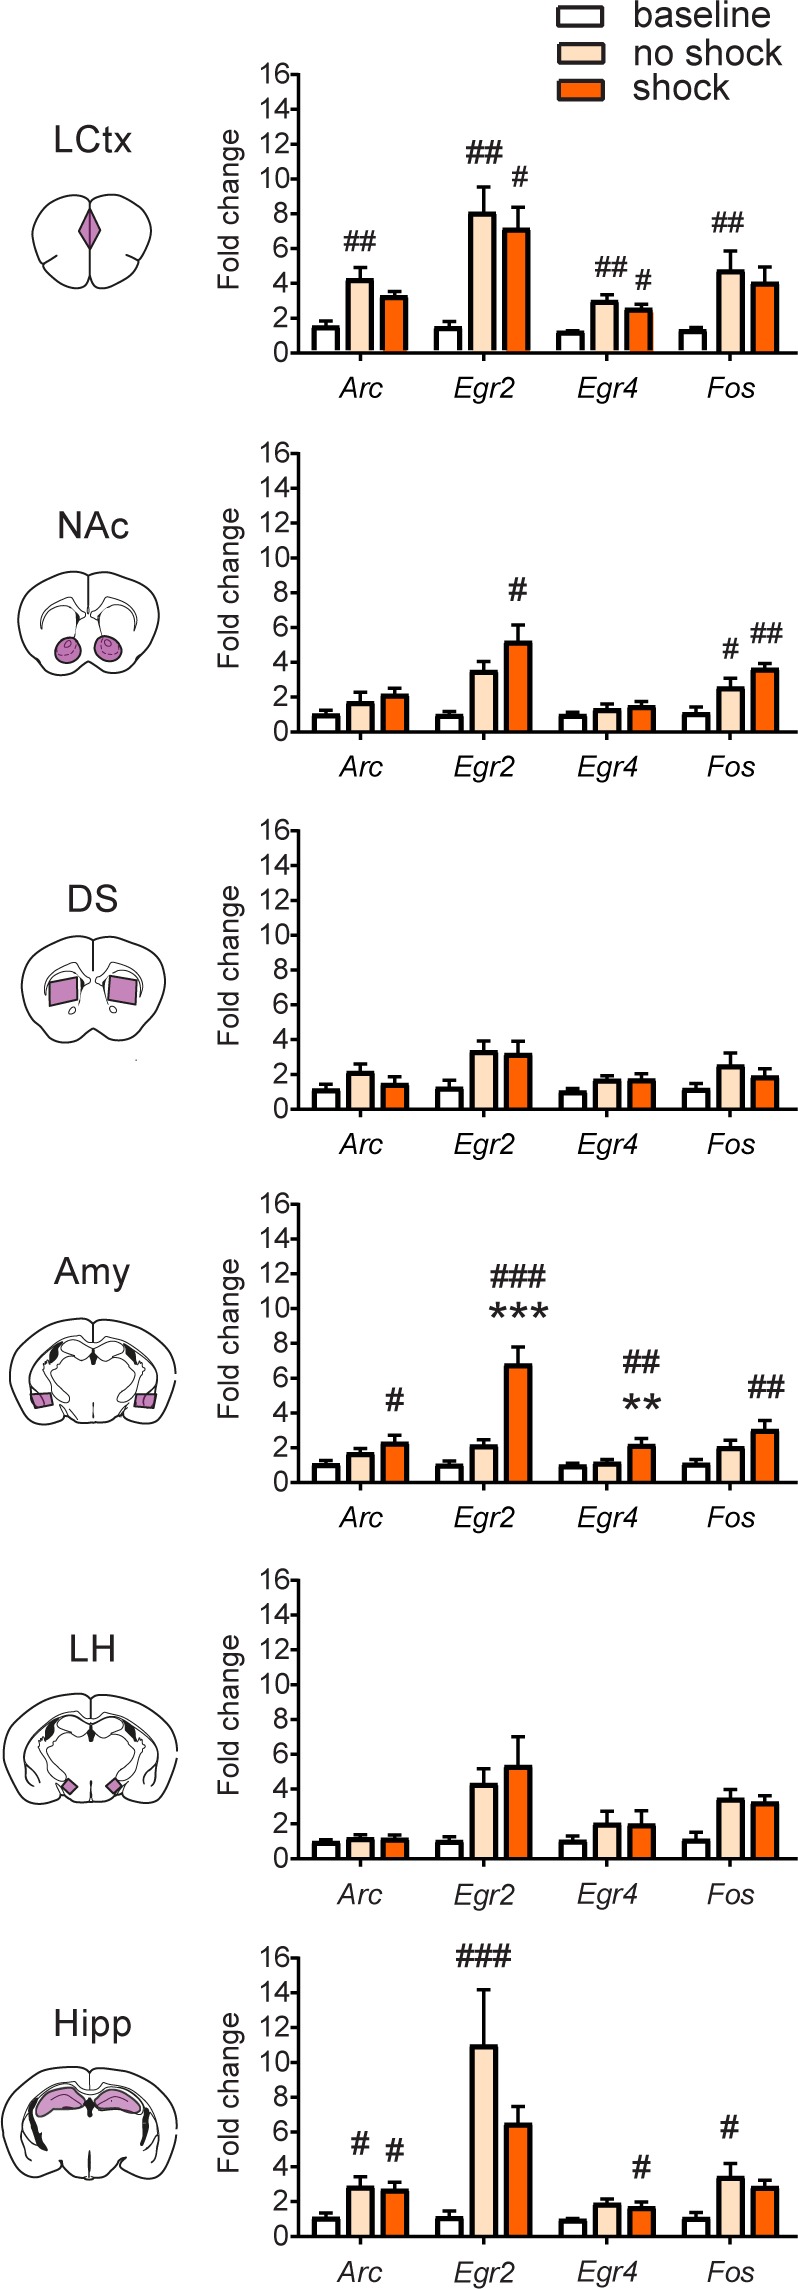
Figure 2—figure supplement 3. Transcriptional representation of habituation and reinforcement.

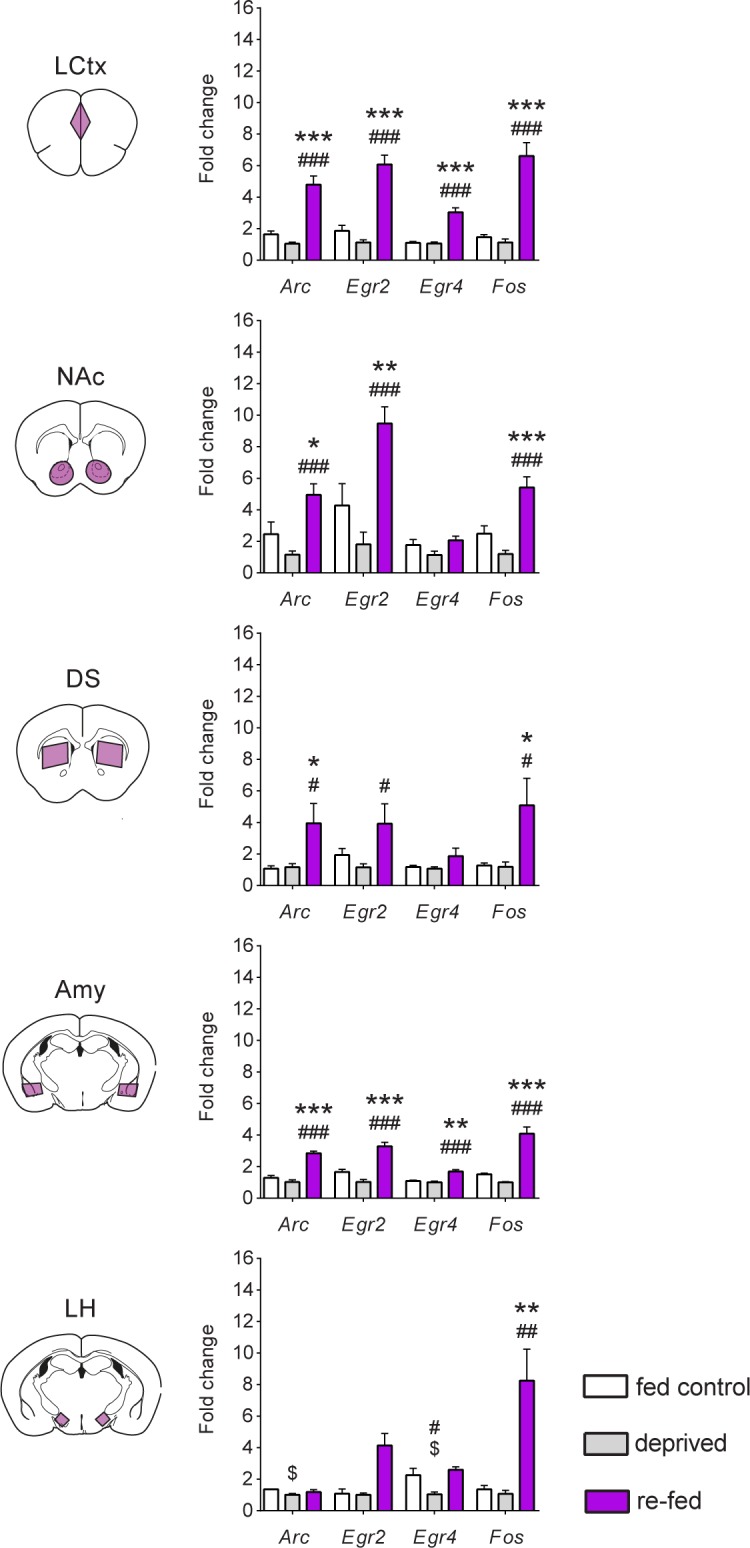
Figure 2—figure supplement 4. Reinstatement of feeding is represented by robust transcriptional dynamics.

Figure 2—figure supplement 5. Reinstatement of feeding is represented by robust transcriptional dynamics.