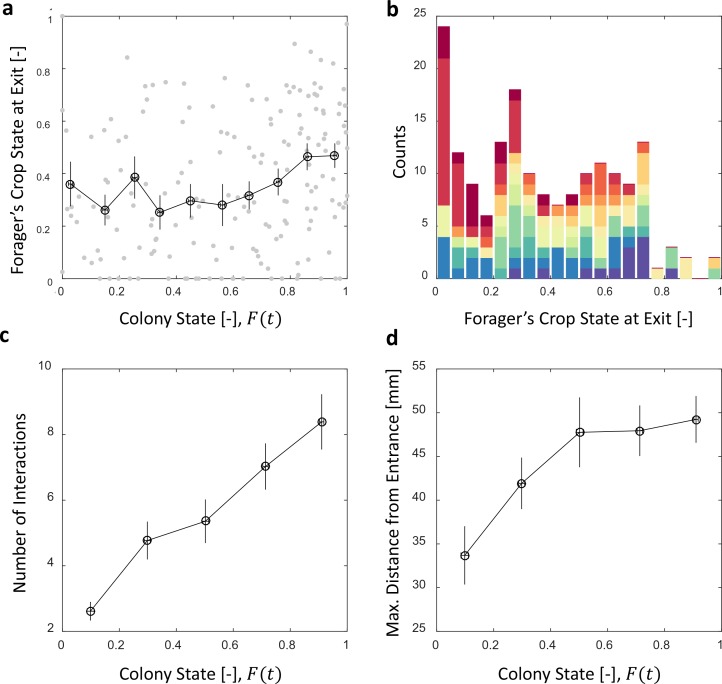
Figure 5. Foragers’ crop loads at exit.
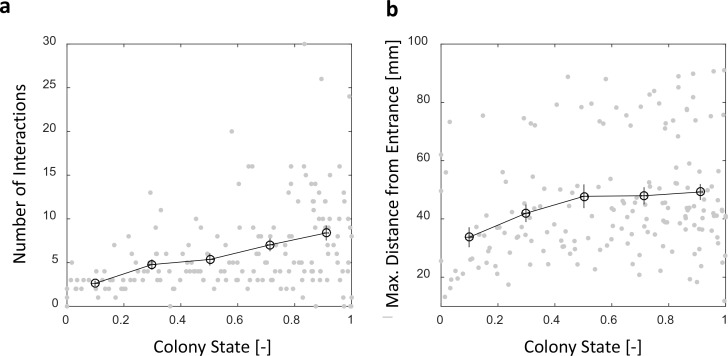
(a) Foragers’ crop loads at the moments of exit were only weakly dependent on colony state (Spearman’s correlation test, , ), the average remaining approximately constant with only a slight rise at high colony states. Gray: raw data, black: mean SEM of binned data (n = 11,15,13,13,15,13,17,22,27,30 for bins 1–10, respectively). (b) The wide distribution of foragers’ crop loads at the moments of exit (n = 176). Each color represents a different forager, revealing that the distribution of crop loads upon exit is wide within each forager and not due to inter-individual variability. (c) The number of interactions a forager has in a single visit to the nest rises as the colony satiates, mean SEM of binned data (n = 26,26,28,39,57 for bins 1–5, respectively, Figure 5—figure supplement 1a). (d) Foragers reach deeper locations in the nest as the colony satiates, mean SEM of binned data (n as in panel c, Figure 5—figure supplement 1b). All panels relate to the pooled data from all three observation experiments. Source file is available in the Figure 4—source data 1.


